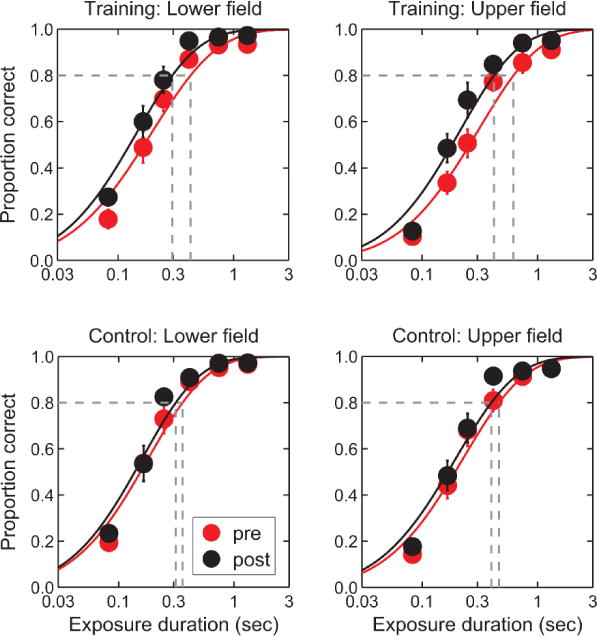
Figure 6.

Pre- and post-measurements of RSVP reading performance at 10° in the lower and upper visual fields for both the training group (top panels) and no-training control group (bottom panels). The vertical dashed lines indicate the exposure durations corresponding to 80% accuracy of word recognition (represented by the horizontal dashed lines). Error bars represent ± standard errors.
