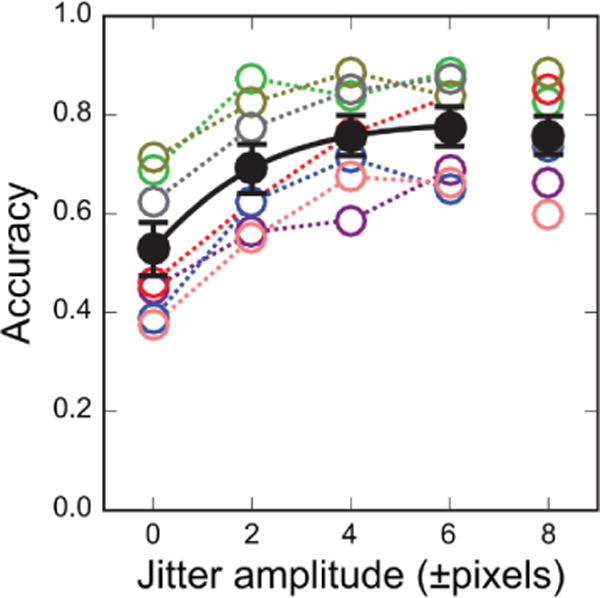
Figure 2.

Accuracy of letter identification is plotted as a function of jitter amplitude for the seven individual subjects (open circles and dotted lines; different colors represent different subjects) and the group average (filled black circles; error bars indicate standard errors). The black line represents the best-fitted exponential function for the group data between 0 and 6 pixels (the range of jitter amplitude used for training).
