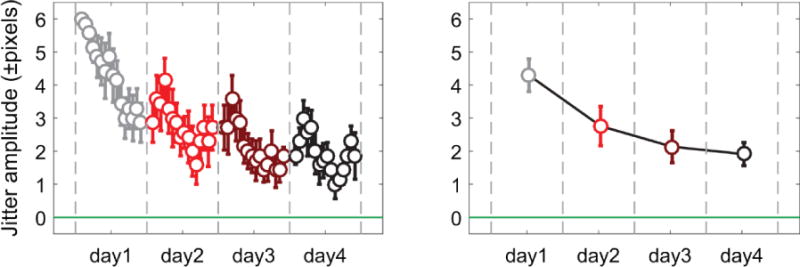
Figure 4.

Changes of jitter amplitude during training. Left panel: block-by-block changes of jitter amplitude (averaging across subjects). The open circles represent performance accuracy during training, one for each block (16 blocks per day). The data for different days were plotted in different colors. Right panel: day-by-day changes (averaging across subjects and blocks). Vertical dashed lines indicate the boundaries between days. The horizontal line represents the zero jitter amplitude. Error bars indicate standard errors.
