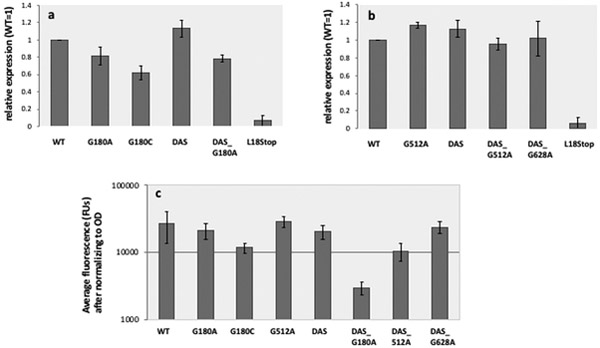
Fig. 8. Quantification of GFP expression.
a. Western blot values. GFP expression for cells expressing the engineered variants listed in the X axis is shown, as band intensity on a Western blot, determined by densitometry, normalized to that of WT. Error bars represent standard deviation of two biological replicas. b. Fluorescence values. The fluorescence of cultures expressing the engineered variants listed on the X axis was measured as described in Methods and plotted (in log scale) on the Y-axis. Error bars represent standard deviation of 10 biological replicas.

