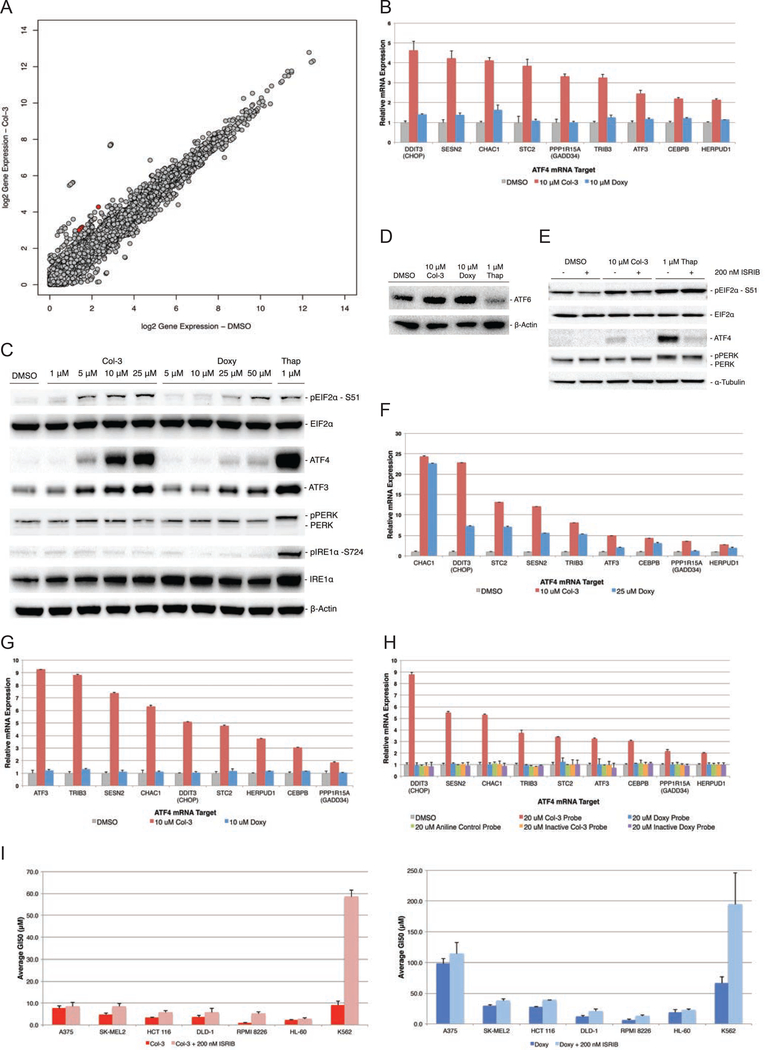
Figure 4– Activation of the ISR by tetracyclines in A375 cells.
(A) Scatter plot of RNA-Seq differential gene expression data analysis for A375 cells treated with Col-3 for 6 hours. Red points represent key ATF4 target genes. (B) Bar graph of results from Nanostring gene expression analysis confirming the ISR/ATF4 gene signature is activated by Col-3 but not doxycycline in A375 cells at 6 h. (C) Western blot showing tetracyclines induce dose-dependent phosphorylation of EIF2α and ATF4 expression at 6 h, but not phosphorylation of PERK or IRE1α. Thapsigargin (Thap), was used as a positive control for induction of ER stress. (D) Western blots showing Col-3 and doxycycline do not stimulate cleavage and activation of ATF6 at 6 h. (E) Western blot showing co-treatment of A375 cells with ISR inhibitor blocks Col-3-mediated activation of ATF4 (F) Bar graph of results from Nanostring gene expression analysis confirming the ISR/ATF4 gene signature in HCT116 and (G) K562 cell lines. (H) Nanostring analysis shows that the Col-3-based bifunctional probe induces expression of ATF4 gene targets in A375, while the gene signature is not activated by the doxycycline-based probe, the aniline control probe, or the inactive tetracycline-based bifunctional probes. (I) Bar graph average growth inhibition (GI50) data for A375, SK-MEL2, HCT 116, DLD-1, RPMI 8226, HL-60, and K562 cells co-dosed with Col-3 or Doxy ± 200 nM ISRIB. Gene expression and GI50 data are represented as mean ± SD. Western blot and proliferation data are representative of at least three independent experiments. See also Figure S5.

