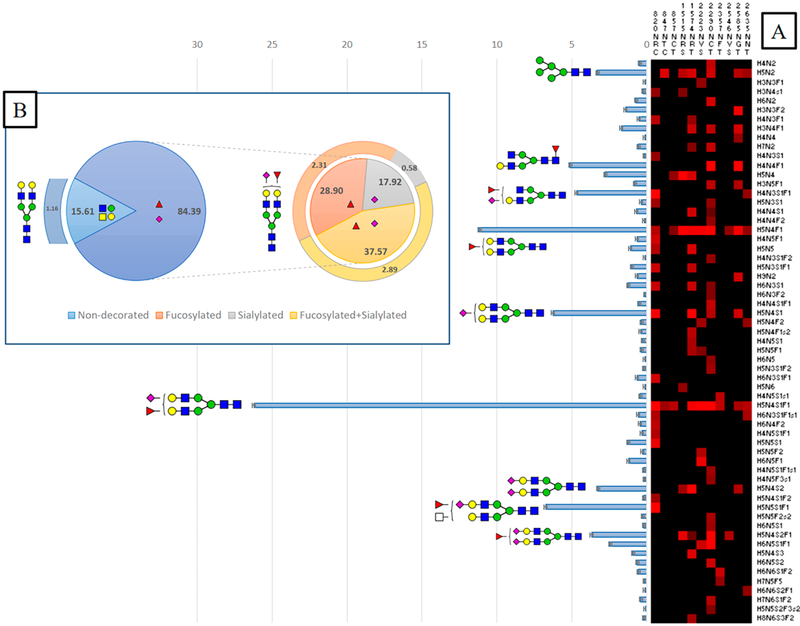
Figure 7.
General characterization of plasma VWF N-glycome (61 compositions). (A) Total relative abundance (TRA) (bars; left side) and site-specific relative abundance (SRA (heat map; right side) of N-glycan compositions). (B) Distribution of N-glycan complexity (the outer circle represents the percentage of sulfated glycans of each type). (blue square) N-Acetylglucosamine (GlcNAc, N), (yellow square) N-acetylgalactosamine (GalNAc, N), (green circle) mannose (Man, H), (yellow circle) galactose (Gal, H), (purple diamond) N-acetylneuraminic acid (Neu5Ac, S), (red triangle) fucose (Fuc, F), and sulfate groups (s).

