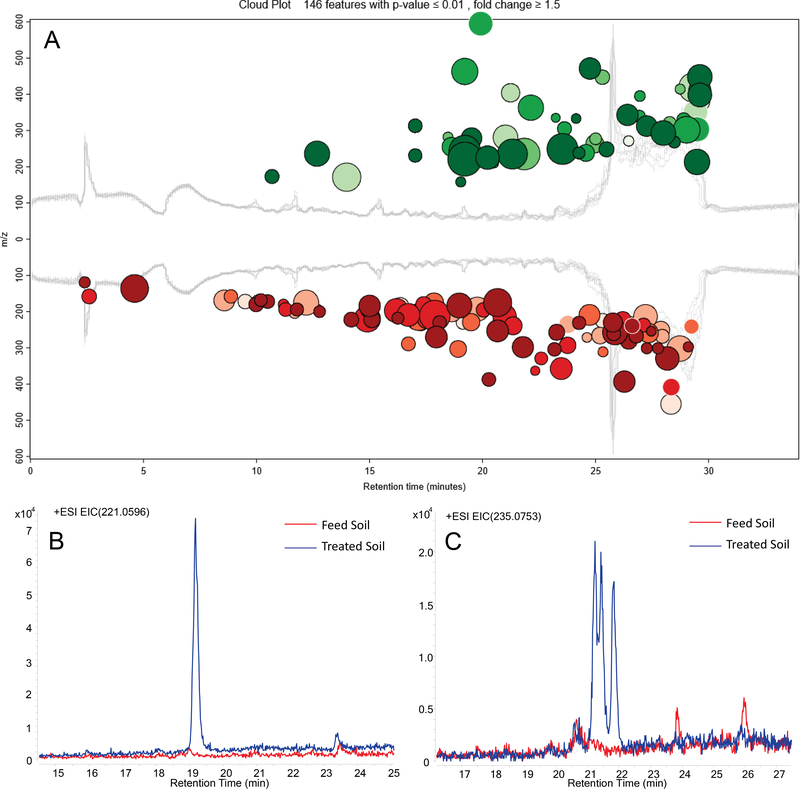
Fig.2.
Non-target analysis of extract subfractions B2. (A) Cloud plot from metabolite profiling comparing the high-resolution mass spectra (ESI+ mode) of subfraction B2 from bioreactor-treated soil to subfraction B2 from feed soil. Mass spectral features with significantly higher intensities in the treated soil than in the feed soil (upregulated) are in green and those significantly lower in the treated soil are in red. Bubble size is proportional to peak intensity; the darker the shading, the higher fold change. All 146 features with intensity ≥ 1,000, fold-change ≥ 1.5 in either direction, and p ≤ 0.01 are shown. (B) and (C) Extracted ion chromatograms for m/z 221.0596 and m/z 235.0753, respectively.

