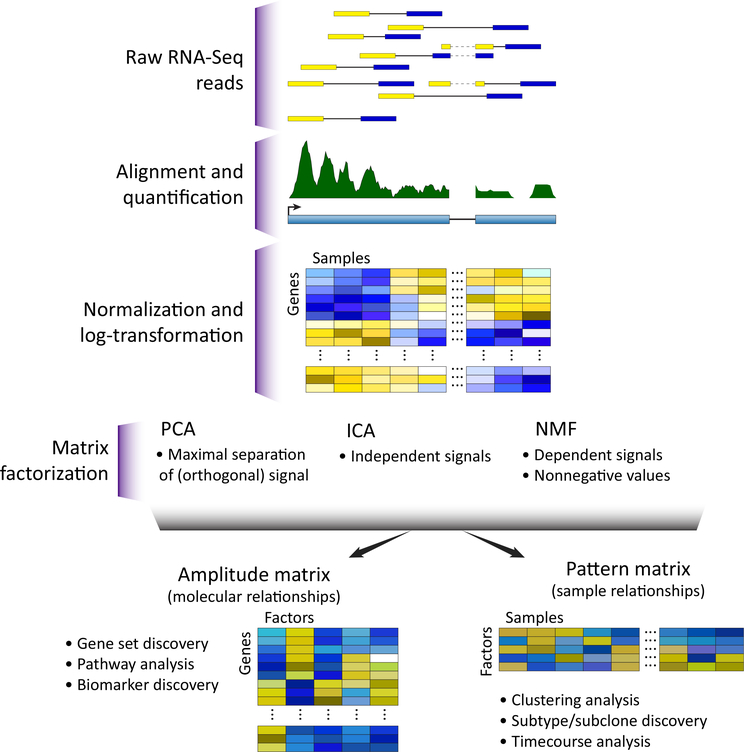
Figure 1. Omics Technologies Yield a Data Matrix That Can Be Interpreted through MF.
The data matrixfrom omics has each sample as a column and each observed molecular value (expression counts, methylation Levels, protein concentrations, etc.) as a row. This data matrix is preprocessed with techniques specific to each measurement technology, and is then input to a matrix factorization (MF) technique for analysis. MF decomposes the preprocessed data matrix into two related matrices that represent its sources of variation: an amplitude matrix and a pattern matrix. The rows of the amplitude matrix quantify the sources of variation among the molecular observations, and the columns of the pattern matrix quantify the sources of variation among the samples. Abbreviations: ICA, independent component analysis; NMF, non-negative matrix factorization; PCA, principal component analysis.

