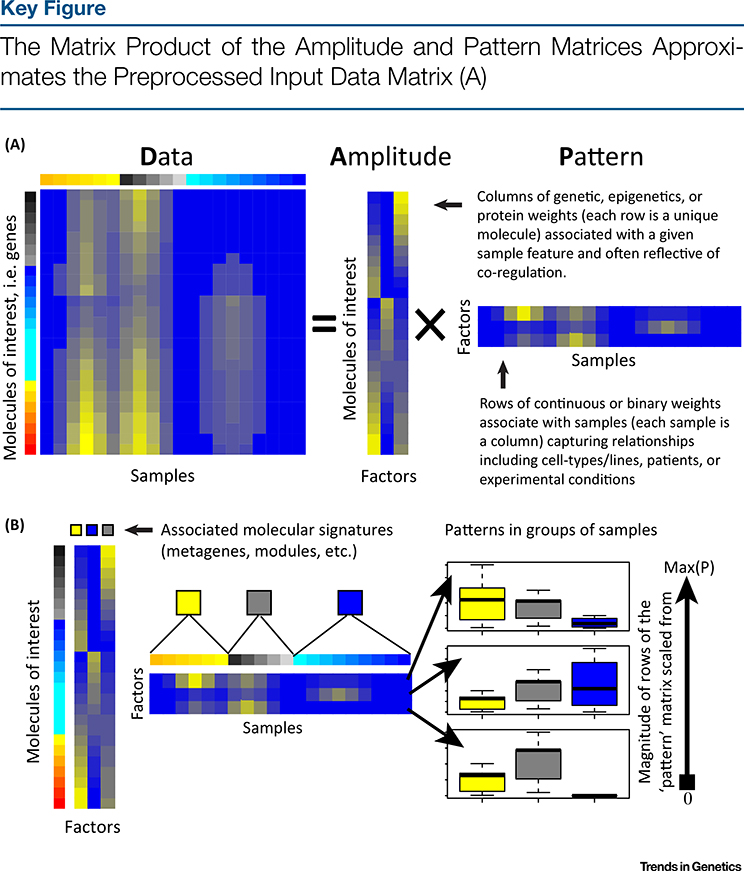
Figure 2.
The number of columns of the amplitude matrix equals the number of rows in the pattern matrix, and represents the number of dimensions in the low-dimensional representation of the data. Ideally, a pair of one column in the amplitude matrix and the corresponding row of the pattern matrix represents a distinct source of biological, experimental, and technical variation in each sample (called complex biological processes, CBPs). (B) The values in the column of the amplitude matrix then represent the relative weights of each molecule in the CBP, and the values in the row of the pattern matrix represent its relative role in each sample. Plotting of the values of each pattern for a pre-determined sample grouping (here indicated by yellow, grey, and blue) in a boxplot as an example of a visualization technique for the pattern matrix. Abbreviation: Max(P), maximum value of each row of the pattern matrix.

