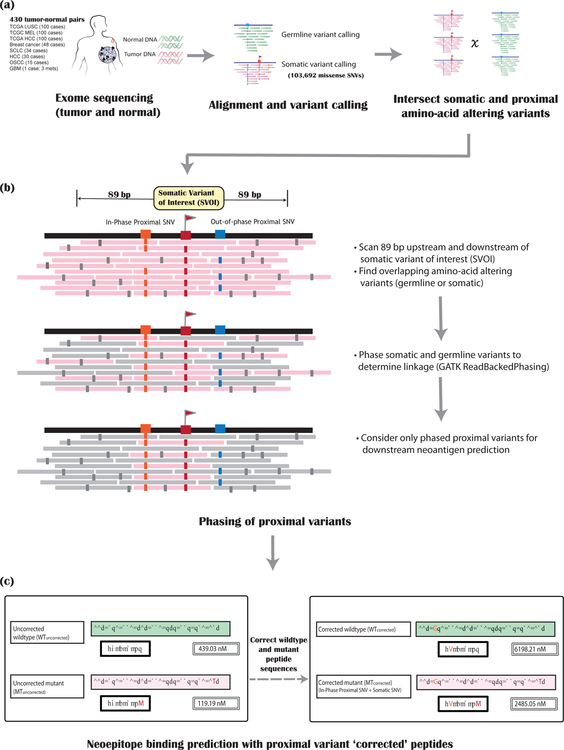
Figure 1: Overview of the pipeline.
The steps required for incorporating and assessing the impact of proximal variants on neoantigen binding prediction are depicted as a flow diagram. There are three main steps. (a) Alignment and variant calling of matched tumor (pink) and normal (green) sequencing data. (b) Phasing of proximal somatic and germline variants: The pink bars represent the tumor sequence reads, with mismatches/sequencing errors shown in small gray rectangles. For a somatic variant of interest (SVOI; labeled with a red flag), we scan 89 bp on either side to assess for proximal germline or somatic SNVs (labeled with blue and orange boxes). These proximal variants are then phased together to determine linkage. Only proximal variants that are in phase (orange box) with the SVOI (red box) are considered for downstream neoantigen analysis. Other (out-of-phase) proximal variants (blue box) are ignored. (c) Neoantigen binding predictions are then assessed after performing proximal variant correction (PVC). The left panel shows the ‘uncorrected’ wildtype and mutant peptides along with their respective binding scores for a single SVOI example. The right panel shows PVC (‘corrected’) peptides and scores for this SVOI.

