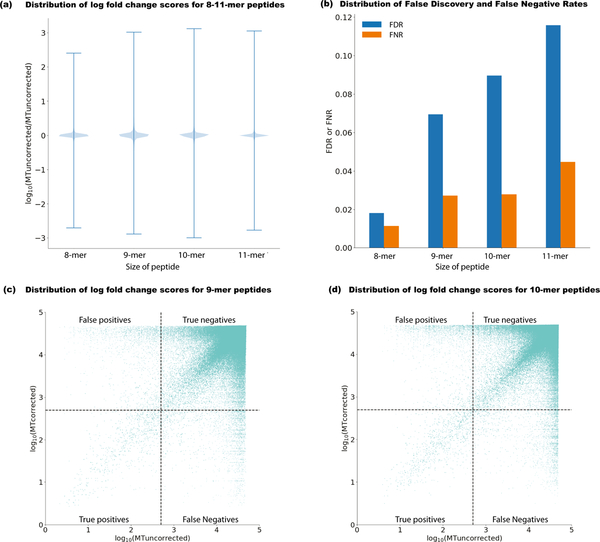
Figure 2: Mischaracterization of neoantigens before proximal variant correction.
The effect of accounting for proximal variants in neoantigen selection is summarized in several ways (n = 380 biologically independent samples with at least one proximal variant). (a) Violin plot (distribution of all data in blue and whiskers indicating max/min values) showing the change in uncorrected neoantigen binding using the existing approach (MTuncorrected) versus PVC (MTcorrected), represented as log10 MT fold change (MTuncorrected / MTcorrected) across 8–11-mers for all variants in phase with the somatic variant of interest. (b) For 8–11-mer peptides, the False Negative Rate (FNR) (shown as orange bars) represents the number of instances when a truly strong-binding peptide was mistaken as a weak-binding peptide (MTuncorrected > 500 nM, and MT fold-change < 1.1 ). The False Discovery Rate (FDR) (shown in blue bars) represents the number of instances where a strong-binder before PVC (MTuncorrected < 500nM) is determined to have an incorrect peptide sequence as a result of a proximal variant. (c) Log10 scaled comparison of corrected versus uncorrected binding scores for 9-mer peptides considering patient-specific MHC Class I alleles. Dotted lines demarcate the binding affinity threshold of 500 nM. (d) Log10 scaled comparison of corrected versus uncorrected binding scores for 10-mer peptides considering patient-specific MHC Class I alleles.

