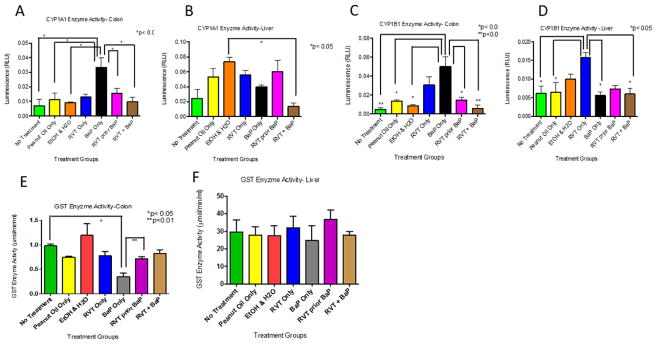
Figure 5. Enzyme activities of Cytochrome P4501A1 (CYP1A1), Cytochrome P4501B1 (CYP1B1), and Glutathione-S-transferase (GST) in the colon and liver of ApcMin/+ mice.
Figs. 5A & 5B correspond to CYP1A1; Figs. 5C & 5D correspond to CYP1B1; Figs. 5E & 5F correspond to GST. Mice were treated with either BaP only, RVT simultaneously with BaP, or RVT prior to BaP. Values are expressed as mean ± SE. *p < 0.05. n = 10.

