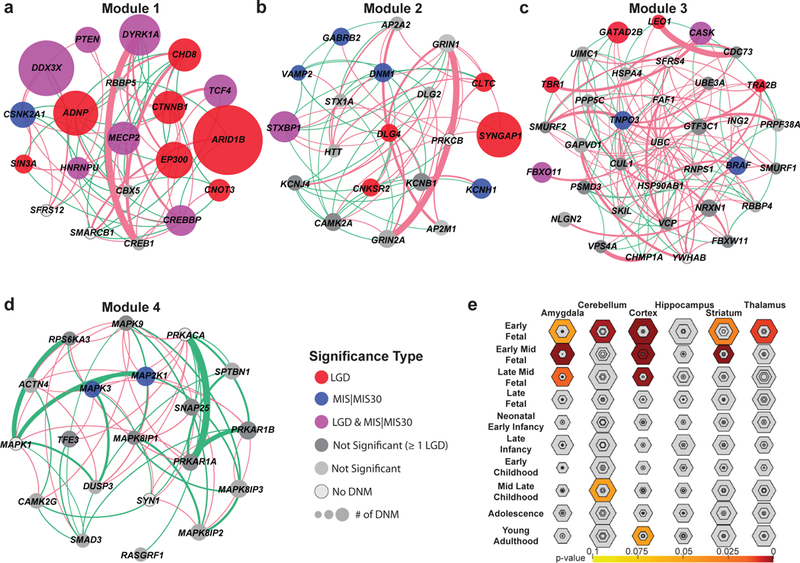
Figure 2: Gene expression and protein-interaction networks.

(A-D) MAGI43 analysis of the union set (n = 253 independent genes) highlights the top four modules of co-expression and protein-protein interaction (PPI), including genes significant for DNM enrichment by denovolyzeR (FDR-adjusted Poisson test) or the CH model (FDR-adjusted binomial test) (colored circles) and new candidate genes with DNM that do not yet reach significance (dark gray). The size of the circle represents the relative number of patients with DNMs within this cohort. Edges depict PPIs (pink arcs) and co-expression (green arcs) scaled by their scores from geneMANIA100. (E) Tissue-specific enrichment analyses (TSEA) of the union set (n = 253 independent genes) highlight a strong bias to various developing parts of the brain with the strongest signal early to mid-fetal development (color corresponds to FDR-adjusted one-tailed Fisher’s exact test p-values, shaded regions closer to the center of each hexagon indicate increasing tissue specificity).
