Figure 5.
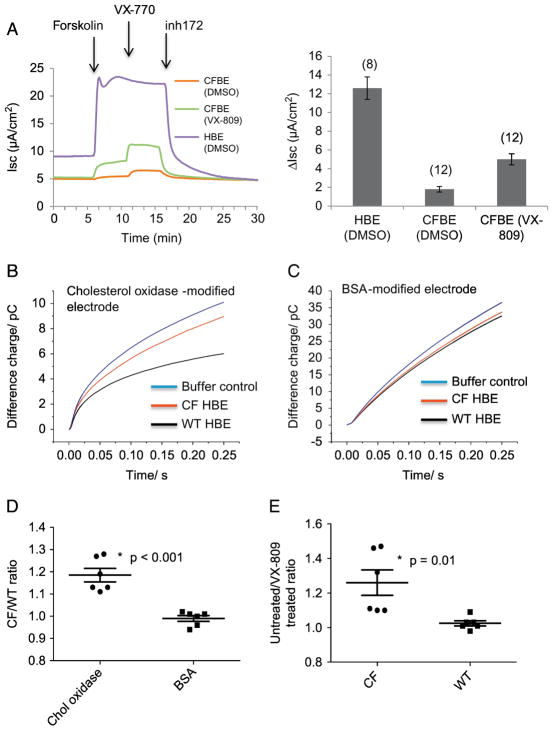
CFTR function and membrane cholesterol measurements in mock treated WT and CF HBE cells and in CF HBE cells with VX-809 treatment. A) Left panel: Representative traces of Ussing chamber analyses of WT and CF HBE cells treated with either DMSO carrier or VX-809 (3.3 μM, 24h). Additions of forskolin (10 μM) and VX-770 (1 μM) to stimulate CFTR function and the CFTR inhibitor inh172 (10 μM) are indicated by arrows. Right panel: Summarized data showing change in Isc (ΔIsc) elicited by inh172 treatment to identify magnitude of CFTR response. The number of filters assayed are shown in parentheses. B,C) representative traces of WT and CF HBE cells measured with cholesterol-oxidase modified electrodes or BSA-modified electrodes as a control. D) Ratio of CF/WT cholesterol measurement values with either cholesterol oxidase or BSA modified electrodes. Significance determined by t-test; (n= 6 electrodes tested on 3 cell pairs for CF and WT cells measured with either cholesterol oxidase-modified or BSA-modified electrodes. P < 0.001). E) Summary data of untreated/VX-809 treated WT and CF HBE cells. Significance determined by t-test; (n= 6 electrodes tested on 3 cell pairs for CF and WT; p=0.01). Data are reported as a ratio of VX-809 treated over mock-treated cells.

