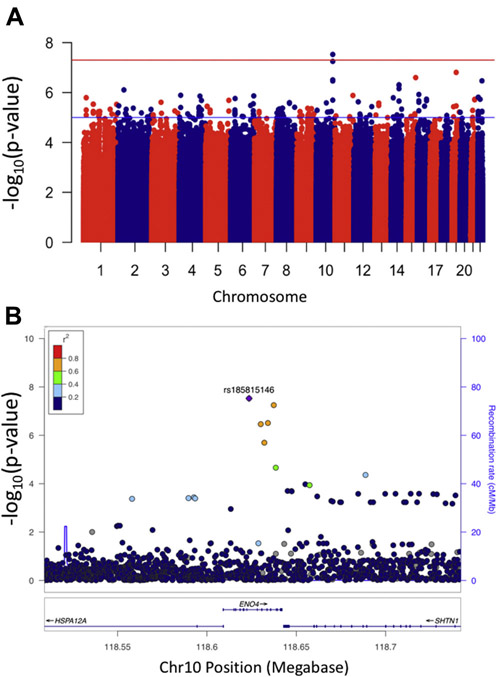
Figure 1. Genome-wide association with advanced POAG.
A) Manhattan plot showing association with advanced POAG in AD subjects. Plot generated using R package “qqman”.55 Red line indicates p-value of 5×10⁻⁸; point above red line is rs185815146. B) LocusZoom plot of ENO4 locus. Plot generated using the LocusZoom “standalone” program. Color of points shows linkage disequilibrium (LD) between rs185815146 and the other SNPs as found in the 1kGP data subset of sub-Saharan Africans (AFR). No LD between rs185815146 and the other SNPs was observed using the “EUR” subset.

