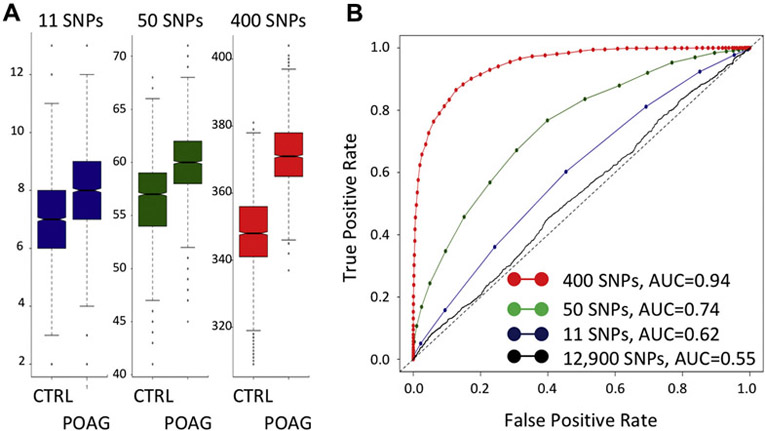
Figure 4. Test of Genetic Risk Scores by Receiver Operating Characteristics.
Genetic risk scores are described were created by adding allele counts across selected SNPs for each subject; a SNP with a negative estimate (beta) was recoded to the other allele so that genotype counts would be additive for POAG risk. SNPs for Genetic Risk Score #1 were the 11 significantly associated SNPs in Table 1 (B, blue line). SNPs for Genetic Risk Score #2 were 50 SNPs selected using a penalized logistic regression and cross-validation procedure (B, green line). SNPs for Genetic Risk Score #3 were 400 SNPs selected by the same penalized logistic regression and cross-validation procedure (B, red line). For comparison, AUC=0.5 is the dotted black line, and AUC from all ~12,900 SNPs is the solid black line. CTRL, controls; POAG, cases.

