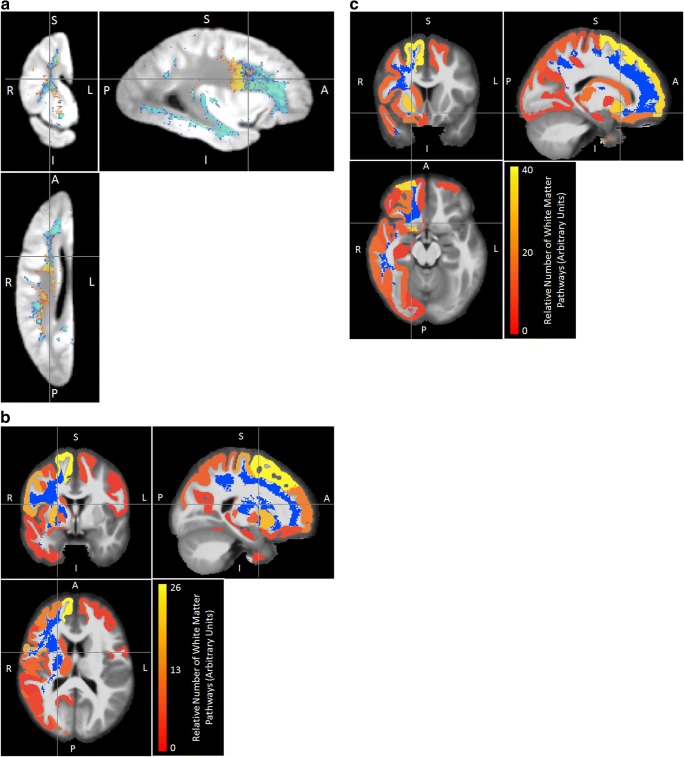
Fig. 3. Maps of methylation-correlated brain areas.
(a) Locations in which ex-vivo transverse relaxation (R2) is correlated with methylation of molecular systems related to cell motility (m66 in blue-green) and a module with unknown functions (m33 in yellow). b Cortical and subcortical gray matter terminals of white matter pathways traversing through the region with R2 values linked to expression of comethylation module m33. c Cortical and subcortical gray matter terminals of white matter pathways traversing through the region with R2 values linked comethylation module m66

