Fig. 4.
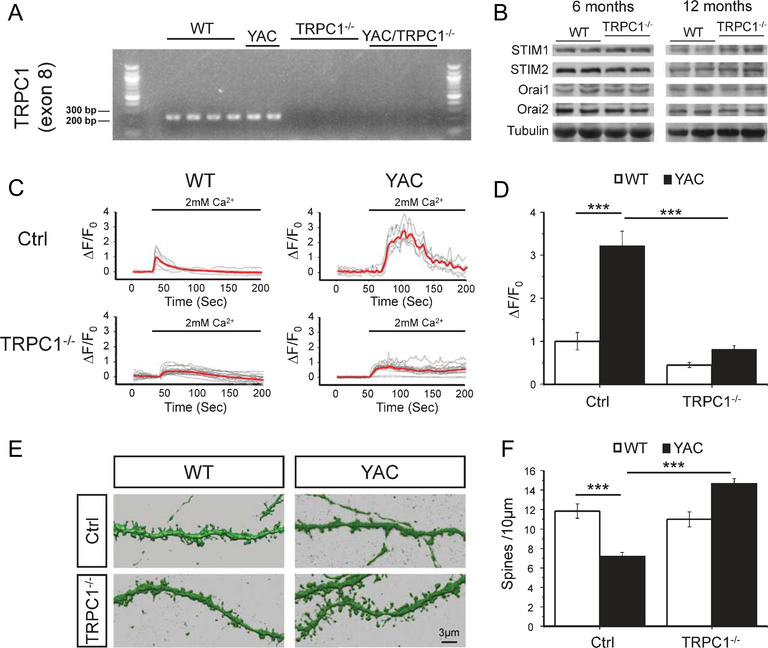
Knockout of TRPC1 prevents YAC128 MSN spine loss and reduces MSN spine nSOC. (A) RT-PCR was used to detect exon 8 of TRPC1 from WT, YAC128+/−, TRPC1−/− and YAC128+/−TRPC1−/− mice. (B) Striatal lysates from 6 months and 12 months old WT and TRPC1−/− mice were analyzed by western blotting for STIM1, STIM2, Orai1 and Orai2. (C) GCaMP5G was used to image spine Ca2+ signals in response to calcium add back in co-cultures from WT, YAC128+/−, TRPC1−/− and YAC128+/−TRPC1−/− pups. The data are shown as change in relative GCaMP5G fluorescence over time. The time of “Ca2+ add-back” is shown above the fluorescence traces. Activity of SERCA pump in these experiments is blocked by 1μM thapsigargin (Tg). Individual cell traces are shown by thin grey lines, and average traces are shown by thick red lines. (D) Quantification of spine nSOC. The average peak of spine SOC was normalized to peak nSOC in WT control cultures and shown as mean ± SE (WT, n=8; YAC128, n=6; TRPC1−/−, n=17; and YAC128+/−TRPC1−/−, n=21). (E) Reconstructions from confocal images of DARPP32-immunostained MSN dendrites and spines are shown for DIV 20 corticostriatal co-cultures prepared from WT, YAC128+/−, TRPC1−/− and YAC128+/−TRPC1−/− pups. (F) Quantification of spine density. An average spine density in corticostriatal co-cultures is shown as mean ± SE (WT, n=10; YAC128, n=10; TRPC1−/−, n=10; and YAC128+/−TRPC1−/−, n=10). ***p<0.001 for pairwise comparisons as shown.

