
Figure 1. Descending neuron activity correlates with spontaneous and looming-elicited changes in L-R WSA.
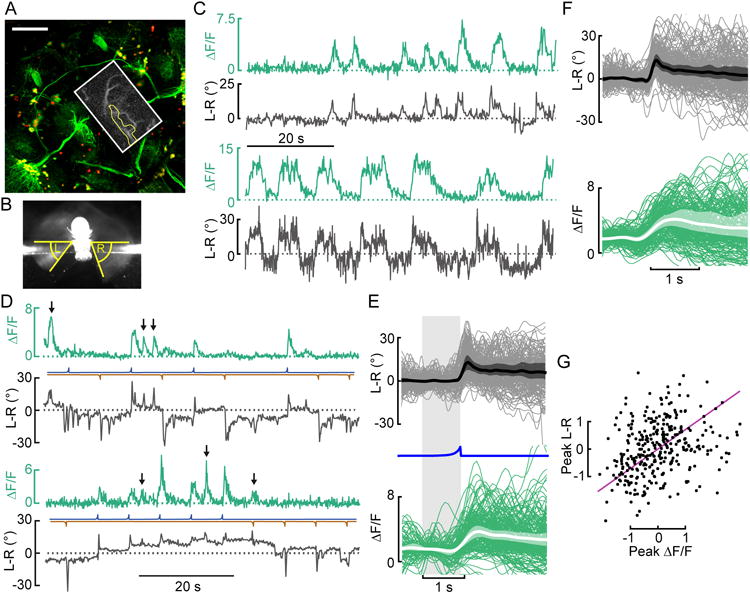
(A) Maximum intensity projection of mCDGFP and stingerRed expression in the whole brain driven by R56G08-Gal4. A 261μm z-stack was taken with the 2-photon microscope (scale bar: 50μm). The approximate imaging area is depicted with a white box. An example image (maximum intensity projection of the tdTomato-signal of one experimental trial) with the region of interest highlighted in yellow is shown as inset. See also Movie S1. (B) Image of a fly taken from below illustrating the measurement of left (L) and right (R) wing stroke amplitude (WSA). (C) Representative traces of spontaneous changes in L-R WSA (L-R) and GCaMP6f fluorescence in AX (ΔF/F) from 2 (out of 19) recorded flies in the absence of visual stimulation. (D) Two example traces of changes in L-R and ΔF/F in AX during presentation of looming stimuli presented either left (blue) or right (brown). Several spontaneous saccades (black arrows) occur in between looming stimuli. (E) Top panel: Baseline-subtracted mean L-R (thick line), boot-strapped 95% CI for the mean of fly means (shaded area), and individual responses (thin lines) to looming stimuli on the left (blue line). Bottom panel: Same as top panel, but baseline-averaged ΔF/F instead of baseline-subtracted traces. N=13. (F) Same as E, with L-R and ΔF/F for spontaneous saccades. (G) For pooled responses to looming stimuli (E) and spontaneous saccades (F), a total least squares regression of fly sample version z-scores (purple line) explained 66.1 % of the variance between peak responses in ΔF/F and L-R (N=13).