
Figure 2. AX activity is linked to deviations from a straight flight path.
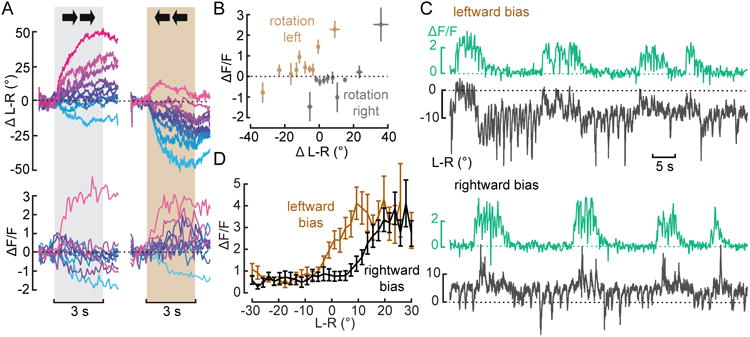
(A) Mean baseline-subtracted changes in L-R WSA and ΔF/F in response to a horizontally moving grating grouped into 10 equally spaced bins based on the magnitude of the behavioral response. Corresponding trials are colored the same. N=9 flies, n=57/65 trials. See also Figure S1. (B) Mean +/- 1 s.e.m. changes in ΔF/F during stimulus presentation plotted against simultaneous changes in L-R for all bins from A. (C) Example traces of simultaneously recorded changes in L-R and ΔF/F from the putative descending neuron during closed loop with a constant bias of left- or rightward motion (temporal frequency: 1.56 Hz.) (D) Mean changes in ΔF/F plotted against L-R for a bias of rightward (black) or leftward (brown) motion. N=10 flies.