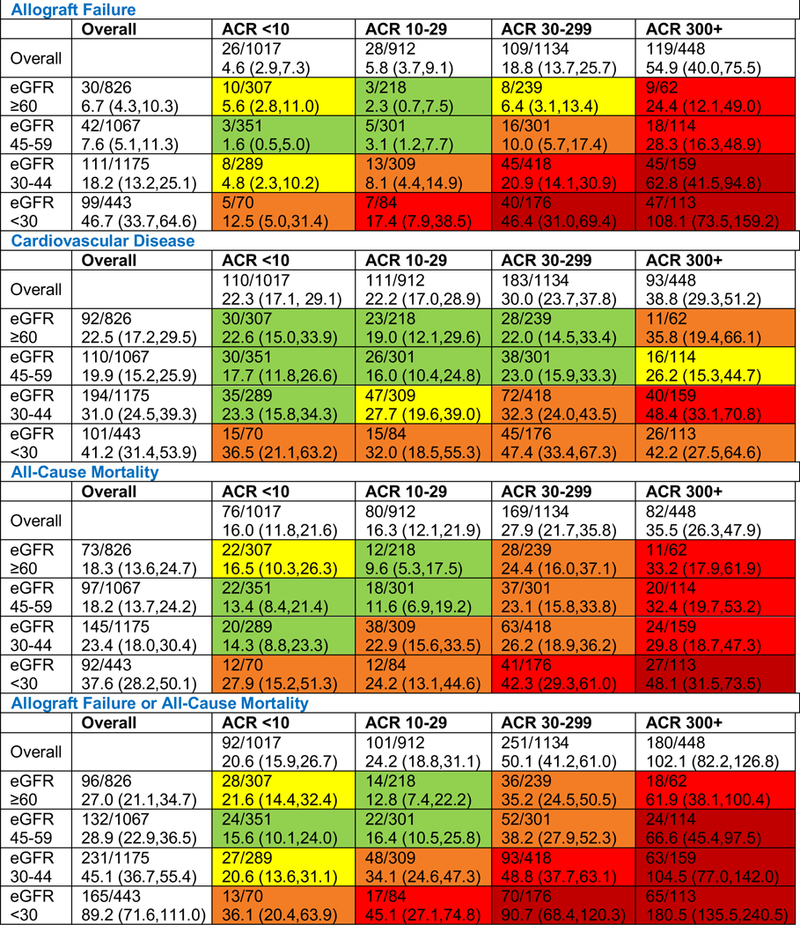
Figure 2. Adjusted event rates per 1000 patient years by eGFR and urine albumin-creatinine ratio strata.

Rates are presented per 1,000 person-years of clinical outcomes calculated using Poisson regression. Data are presented as the number of individuals with an event/number in the eGFR/ACR stratum followed by the adjusted rate (95% confidence interval). For CVD, mortality, and the composite of allograft failure and mortality outcomes, as compared to the lowest group, green shading indicates a 1 to 1.5 fold increased event rate; yellow a 1.5–2 fold increased rate; orange a 2–3 fold increased rate; red a 3–5 fold increased rate, and dark red a 5+ fold increase. For allograft failure, green shading indicates a 1–2 fold increased rate; yellow 2–5; orange, 5–10; red, 10–20 and dark red, 20+. For the composite of allograft failure and death, green shading indicates a 1–2 fold increased rate; yellow 2–5; orange, 5–10; red, 10–20 and dark red, 20+. Models adjust for age, sex, race, study allocation, country, graft vintage, donor type, calcineurin inhibitor use, sirolimus use, diabetes, history of cardiovascular disease, smoking status, systolic blood pressure, diastolic blood pressure, body mass index, HDL cholesterol, LDL cholesterol, triglycerides, angiotensin converting enzyme inhibitor or angiotensin receptor blocker use, aspirin use, and statin use. ACR, albumin-creatinine ratio in mg/g; eGFR, estimated glomerular filtration rate in mL/min/1.73m2.
