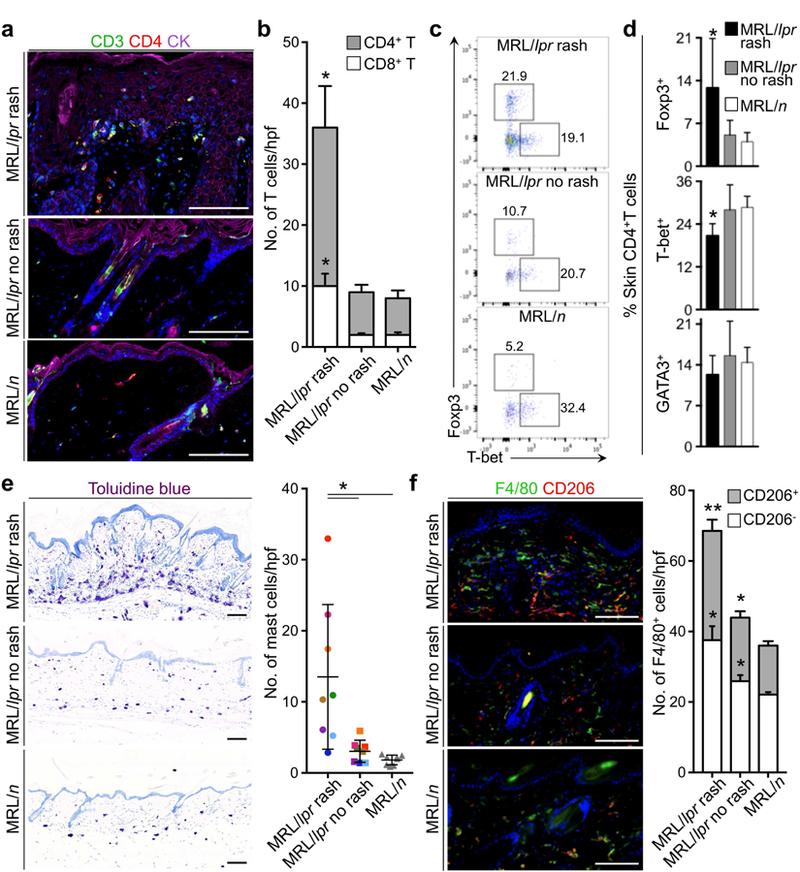
Figure 3. Tumor-promoting immune cells dominate the immune environment of MRL/lpr skin rash.

(a) Representative images demonstrate CD4+ T cells in MRL/lpr and MRL/n skin (CK: cytokeratin). (b) CD4+ and CD8+ T cell infiltrates in MRL/lpr rash, no rash and MRL/n control skin are quantified in 10 random high power fields (hpf) per skin section and averaged across the animals in each group. (c) Flow plots show the percentage of Foxp3+ (Treg) and T- bet+ (Th1) CD4+ T cells isolated from MRL/lpr rash, no rash and MRL/n skin. (d) Average % Foxp3+ Tregs, T-bet+ Th1 and GATA3+ Th2 cells in MRL/lpr rash, no rash and MRL/n skin are shown. (e) Representative images of toluidine blue-stained MRL/lpr rash, no rash and MRL/n skin and quantification of Mast cells in 10 random hpf per skin section across the animals in each group are shown. Color-coded points highlight the number of mast cells in rash and no rash skin samples from the same MRL/lpr mouse. (f) Representative images show CD206+ F4/80+ M2 macrophages in MRL/lpr rash, no rash and MRL/n skin and the bar graph demonstrates the average number of macrophages in 10 random hpf per skin section across the animals in the study groups. n = 8 per group; stained cells were counted blindly; *p < 0.05; **p < 0.01 compared to MRL/n control skin by Student’s t test; scale bars: 100 µm.
