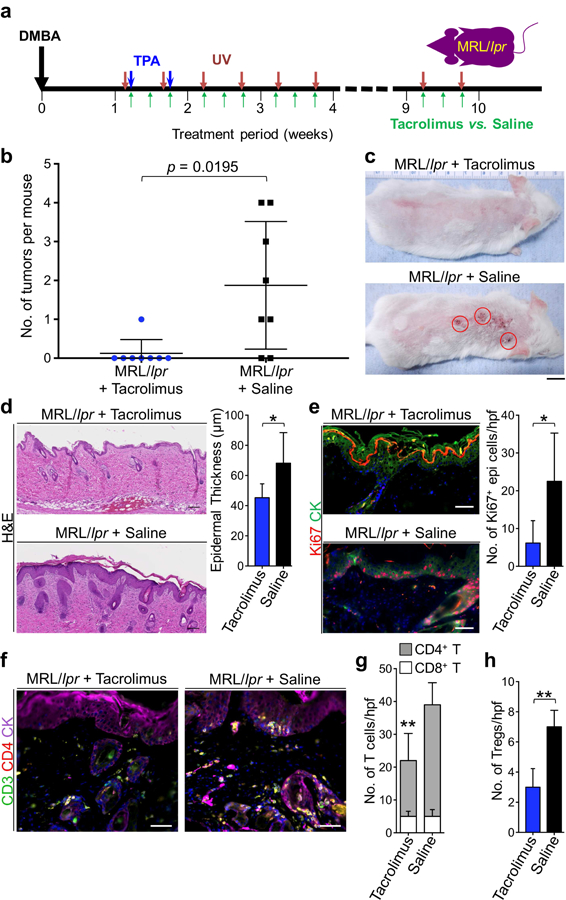
Figure 4. Tacrolimus inhibits tumor development in the context of lupus-associated inflammation.

(a) Schematic diagram of the protocol used to test the effect of tacrolimus on skin cancer promotion in the setting of chronic cutaneous lupus inflammation. All mice received DMBA/TPA to initiate skin carcinogenesis followed by UV to induce and maintain skin rash. (b) Number of tumors developed in MRL/lpr mice receiving tacrolimus is compared to the number of tumors developed in MRL/lpr control mice receiving saline (p = 0.0195 by Student’s t test). (c) Representative images of tacrolimus- and saline-treated MRL/lpr mice that completed carcinogenesis protocol are shown. (d) Representative H&E stains of skin rash in MRL/lpr mice treated with tacrolimus or saline are shown. Epidermal thickness is determined based on measurements obtained from 10 random areas of skin per mouse. (e) Representative Ki67 and cytokeratin immunofluorescent staining of tacrolimus- and saline-treated MRL/lpr mice are shown. Bar graph demonstrates the average number of Ki67+ epidermal keratinocytes per hpf in skin rash from tacrolimus-treated MRL/lpr mice compared to that of saline-treated MRL/lpr mice. (f) Representative CD3, CD4 and cytokeratin stainings of skin rash from tacrolimus- and saline- treated MRL/lpr mice are shown. (g) The average number of CD4+ and CD8+ T cell infiltrates is quantified by counting the number of cells in 10 random hpf per skin rash section and averaging the counts across the tacrolimus-treated compared to saline-treated MRL/lpr mice. (h) Bar graph shows the average number of Foxp3+ Tregs in the skin of tacrolimus-treated and saline- treated MRL/lpr mice as calculated using the histological counts of CD4+ T cells in the skin and the percentage of these cells that are Foxp3+ on flow cytometry (Supplementary Figure S9). n = 8 per group; stained cells were counted blindly; *p < 0.05; **p < 0.01 compared to saline-treated MRL/lpr control skin rash by Student’s t test; scale bars: 100 µm.
