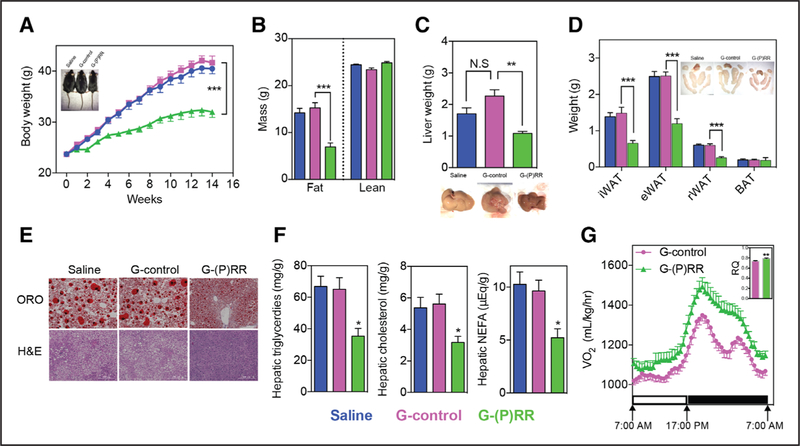
Figure 5. Hepatic (pro)renin receptor ([P]RR) inhibition attenuates diet-induced obesity and metabolic dysregulation.
Eight-week-old mice were injected with saline (blue), G-control (magenta), or G-(P)RR (green) and fed a high-fat diet (HFD) for 14 weeks. (n=10 per group.) A, Body weight was monitored during the study period and each point and error represent the mean±SEM. ***P<0.001. Representative picture showing that G-(P)RR–injected mice are leaner than control mice. B, Fat and lean mass were measured by EchoMRI. Each bar and error represent the mean±SEM. ***P<0.001. C, Liver weight, and representative pictures showing G-(P)RR–treated mice have less fatty liver. **P<0.01. D, Weight and representative picture of different adipose tissue depots. Brown fat tissue of saline and G-control–injected mice were surrounded with white fat which was removed to give a correct estimation of the weight of the brown fat. ***P<0.001. E, Representative images of Oil RedO (ORO) and H&E (hematoxylin and eosin) staining of the livers (scale bar=200 μm). F, Hepatic lipids were extracted and measured. *P<0.05; G-control vs G-(P)RR. G, Oxygen consumption and 24-h average respiratory quotient (RQ) of G-control–injected and G-(P)RR–injected mice was monitored with a metabolic monitoring system 4 days before euthanize. n=8 per group. BAT indicates brown adipose tissue; eWAT, epididymal white adipose tissue; iWAT, inguinal white adipose tissue; N.S., not significant; and rWAT, retroperitoneal white adipose tissue.

