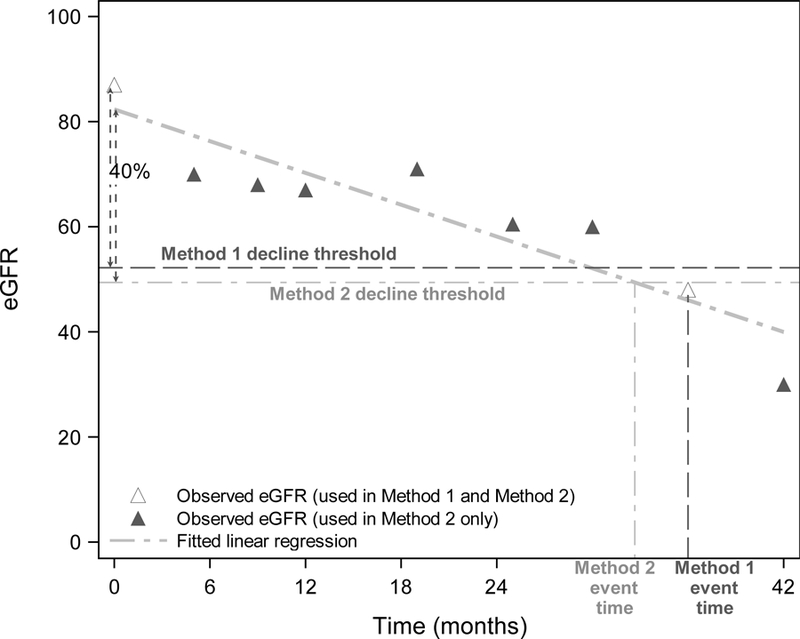
Figure 1:

Example eGFR data to demonstrate estimated time to 40% decline using the standard two-point method (Method 1) and our proposed regression method (Method 2). Dashed horizontal lines represent 40% decline thresholds for each method. Hollow triangles represent the two eGFR measurements used for Method 1, whereas all eGFR assessments (hollow and solid) are used for Method 2.
