
Figure 4:
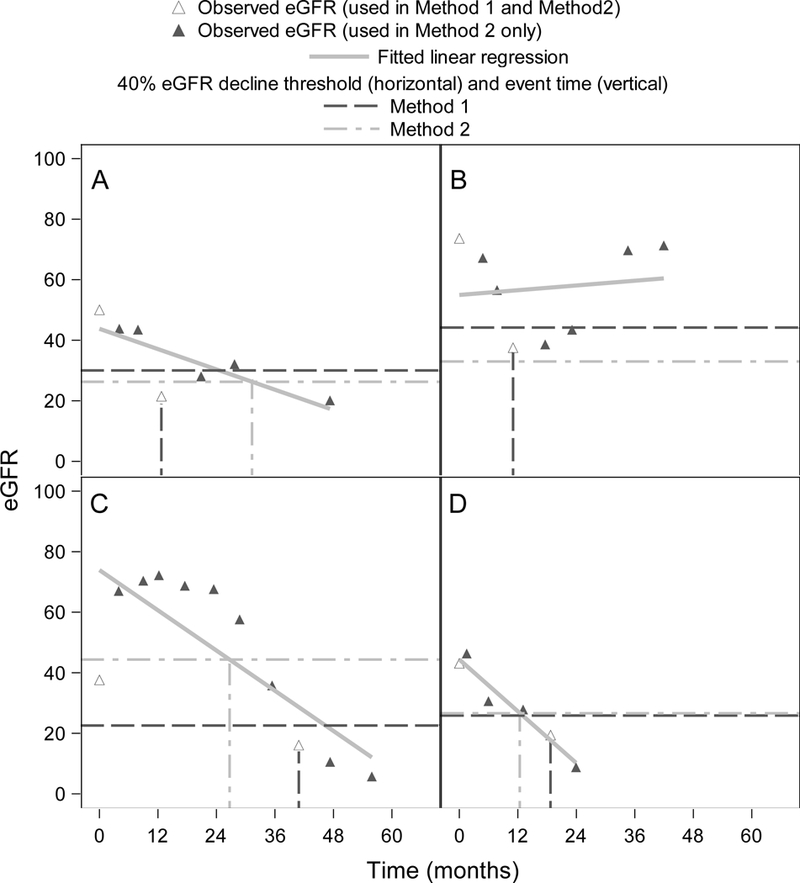
Four example eGFR trajectories from NEPTUNE cohort patients. Dashed horizontal lines represent 40% decline thresholds based on the standard two-point method (Method 1, dark gray) and our proposed regression method (Method 2, light gray). A) Patient with eGFR that dips temporarily from its usual trajectory; B) Patient with non-linear eGFR trajectory; C) Patient whose first eGFR measurement is very different from the regression line intercept; D) Patient with linear trajectory and similar decline thresholds between the two methods.