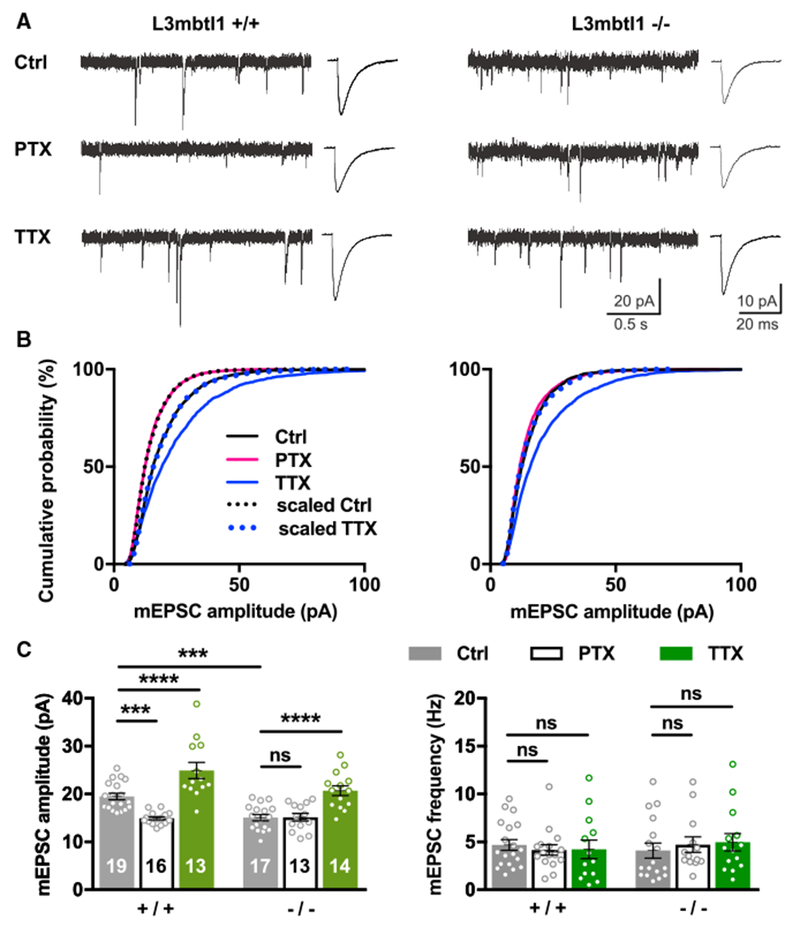
Figure 2. L3mbtl1 Is Required for Basal Excitatory Synaptic Transmission and Homeostatic Downscaling in Hippocampal Primary Neurons.

(A–C) Hippocampal primary cultures were prepared from wild-type (L3mbtl1 +/+)or L3mbtl1 KO (L3mbtl1 −/−) mice. They were treated with PTX (100 μM), TTX (1 μM), or DMSO (0.1%) as a control for 48 hr.
(A) Representative mEPSC traces (left) and average mEPSC event traces (right).
(B) Cumulative distribution of mEPSC amplitudes obtained from L3mbtl1 wild-type and KO primary cultures under three different conditions. Scaled distributions were plotted by multiplying the distribution by a scaling factor and removing values that fell below the detection threshold. Kolmogorov-Smirnov (KS) tests for wild-type distributions: ctrl versus PTX, p = 1.6 × 10⁻³¹; ctrl versus TTX, p = 5.9 × 10⁻¹⁸; scaled ctrl versus PTX, not significant; scaled TTX versus ctrl, not significant. KS tests for KO distributions: ctrl versus PTX, not significant; ctrl versus TTX, p = 1.1 × 10⁻²⁴; scaled TTX versus ctrl, not significant.
(C) Quantification of mean mEPSC amplitudes (left) and frequencies (right).
****p < 0.0001, ***p < 0.001; ns, not significant; two way ANOVA with Sidak’s multiple comparisons test. Numbers in each bar represent the number of neurons tested (N = 5–8 mice were tested). Data shown are means ± SEM.
See also Figures S3 and S4.
