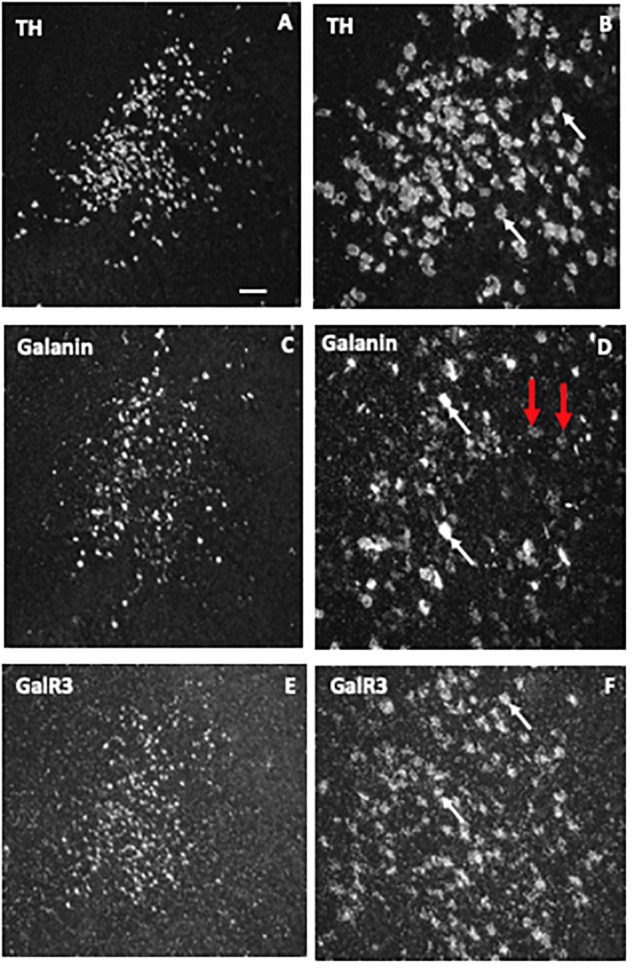
FIGURE 8.

Dark-field ISH photomicrographs showing the distribution of transcripts for tyrosine hydroxylase (TH), galanin, and GalR3 in the locus coeruleus. The three markers TH (A,B), galanin (C,D), and GalR3 (E,F) show overlapping distribution patterns. TH and GalR3 transcript levels seem approximately similar in all cells. In contrast, there is variability in the strength of the signal for galanin mRNA (white arrow points to neurons with a strong signal, red ones to such with a weak signal). Exposure time: TH, 10 days; galanin, 4 weeks; GalR3, 8 weeks. This difference in exposure time transcript reflects difference in transcript levels, that is GalR3 mRNA levels are very low. Reprinted from Le Maitre et al. (2013) [Scale bars: 200 μM for (A,C,E); 50 μM for (B,D,F)].
