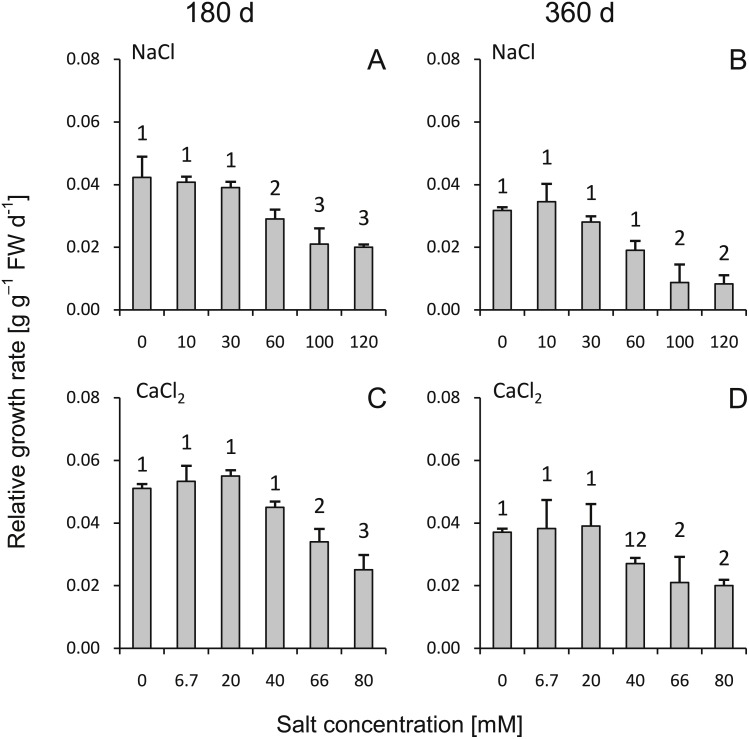
Figure 1. Effects of saline stress on the relative growth rate (RGR) of the silver maple seedlings exposed to different salinity levels (NaCl or CaCl2) after 180 (A, C) and 360 (B, D) days (g g−1 FW d−1).
Values are mean ± SD (n = 4). Different numbers above each bar indicate significant differences by ANOVA followed by Tukey’s test at P < 0.05.

