
Figure 6.
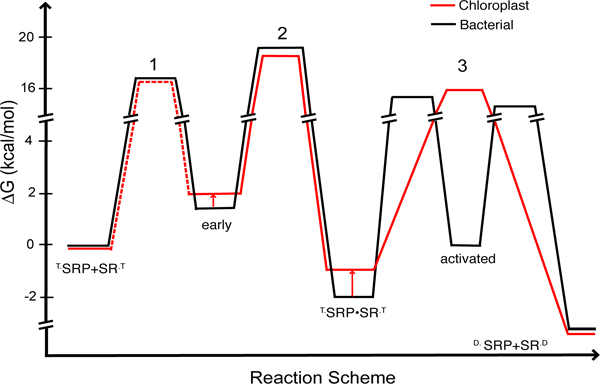
Free-Energy profile for the GTP-dependent binding and activation cycles between the SRP and SR GTPases from bacteria (black) or chloroplast (red). The values for the E. coli GTPases were obtained from references (19, 27). A standard state of 1 μM was used. The activation free energies were calculated from the observed association and dissociation rate constants using ΔG‡ = -RT ln(kh/kBT), where R = 1.987 cal K−1 mol−1, Planck constant h = 1.58 × 10−37 kcal s−1, Boltzmann constant kB = 3.3 × 10⁻²⁷ kcal s, and T = 298K. Equilibrium stabilities of complexes were calculated using ΔG = ΔG° - RT ln(K/K°).