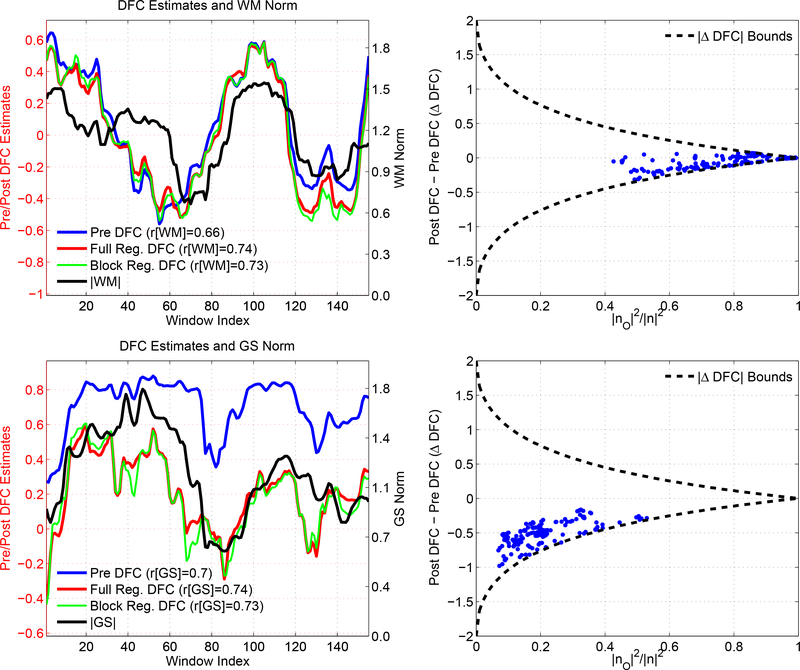
Figure 15:
Two representative scans that demonstrate the theoretical bounds on ΔDFC. In the first column, we show the DFC estimates obtained between the PCC and IPS seeds. In these scans the DFC estimates show a large degree of correlation with the norm of the WM time course (r = 0.66) in the first row, and with the norm of the GS time course (r = 0.7) in the second row. Performing full or block regression does not reduce these correlations and the correlations are larger than 0.7 after each regression technique. In the second column, we show the ΔDFC values versus the orthogonal nuisance fraction for the WM and GS regressors. Each point in these plots corresponds to the orthogonal nuisance fraction and ΔDFC values in a specific window. We also superimpose the theoretical bounds. For the WM nuisance term, the effects of regression are limited by the tight bound imposed by the large orthogonal nuisance fractions. For the GS nuisance term, the bounds are more relaxed due to the smaller orthogonal nuisance fraction. However, the ΔDFC values are clustered around −0.5 and the difference between the Pre DFC and Post DFC values in the first column is also fairly constant. Thus, the Post DFC values remain correlated with the nuisance norms after GS regression.

