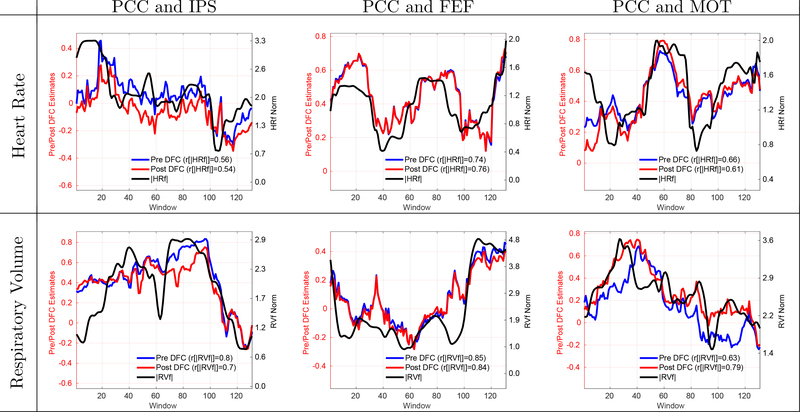
Figure 2:
6 example scans showing that the DFC estimates are significantly (p < 0.03) correlated with the norms of physiological nuisance terms. Row labels indicate the type of physiological nuisance term considered and column labels indicate the seed pair. Correlation values between the DFC estimates and nuisance norms are indicated in the legend labels. The correlations between the Pre DFC estimates and the nuisance norms ranged from r = 0.56 to r = 0.85 with a mean correlation of r = 0.71. The DFC estimates obtained after performing RVHRCOR (Post DFC) are similar to the Pre DFC estimates. The correlations between the Post DFC and the nuisance norms ranged from r = 0.54 to r = 0.84 with a mean correlation of r = 0.71. See Figure 3 and Supplementary Figure 1 for examples of weak and moderate correlations.

