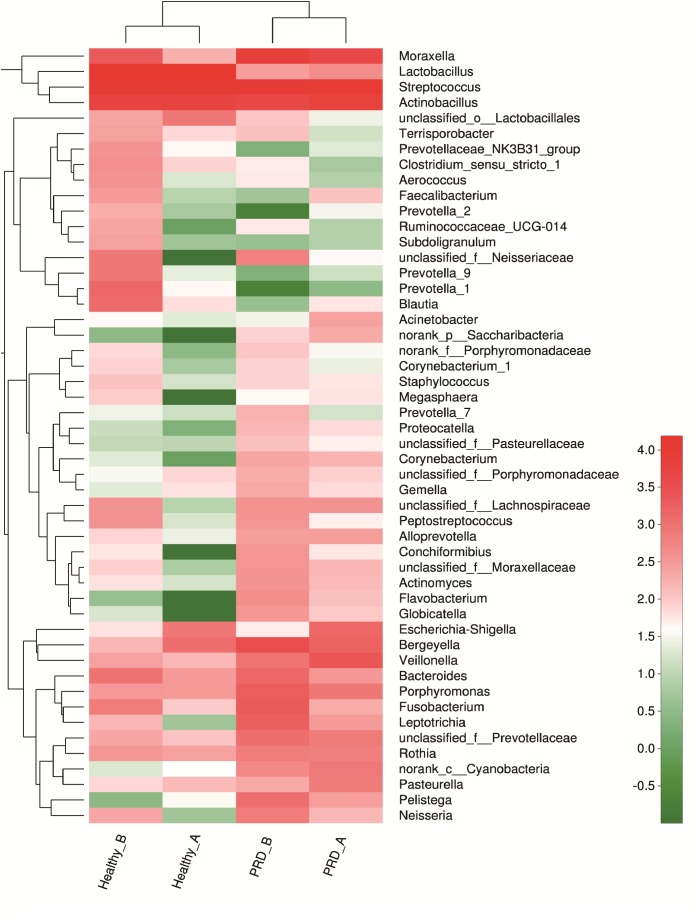
FIGURE 4.
Heatmap analyses of abundant genera in each group (top 50). The bacterial phylogenetic tree was calculated using the neighbor-joining method and the relationship among the four groups was determined by Bray–Curtis distance. The heatmap plot depicts the relative percentage of each bacterial genera (variables clustering on the vertical-axis) within each group (horizon-axis clustering). The color of the spots in the right panel represents the relative values (lg) of the genera in each group.

