
Fig. 7.
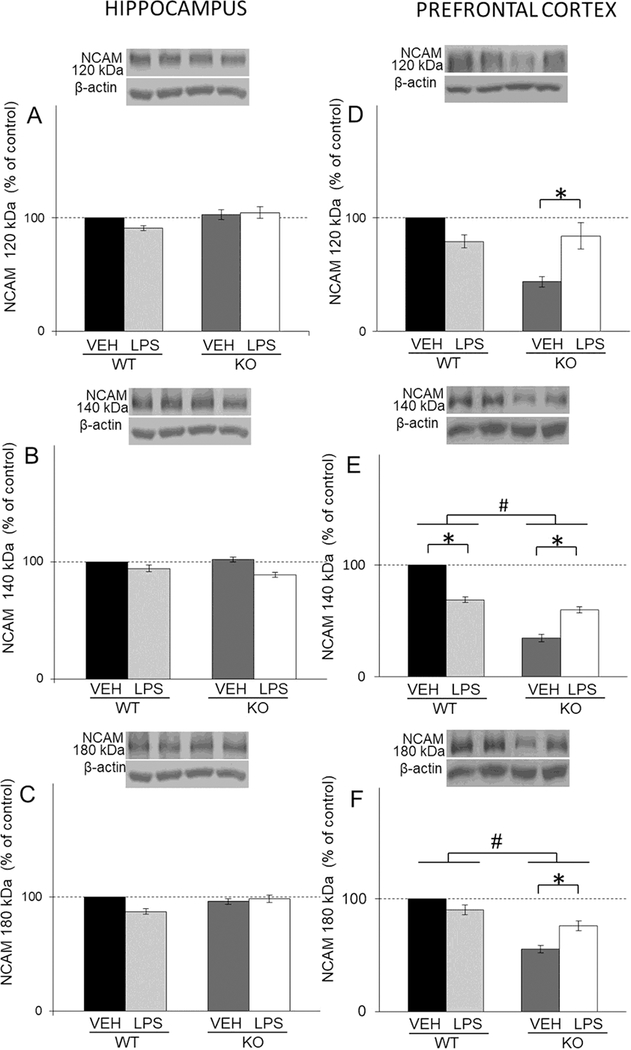
The levels of NCAM isoforms (120/140/180 kDa) in the hippocampal (A, B, C) and PFC (D, E, F) synaptosomal fraction of male wild-type (WT) an GluN2A knockout (KO) mice upon LPS treatment compared to controls (VEH). Values are presented as mean ± SEM % of control values (n=10). Statistically significant differences are given as p < 0.05. *VEH vs. LPS, #WT vs. KO.