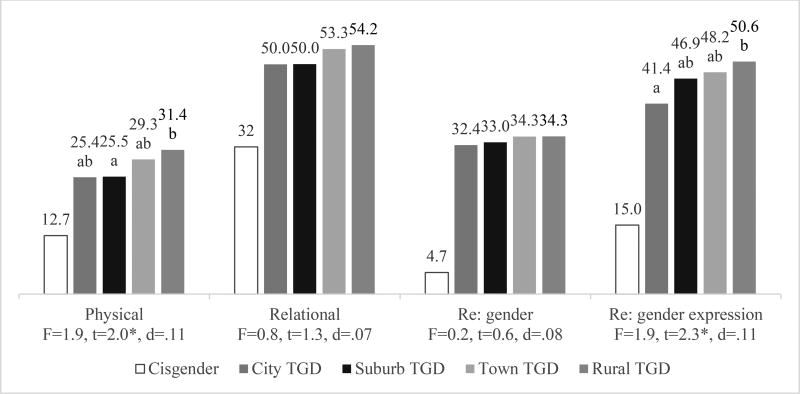
Figure 1. Predicted Probabilities of Bullying Victimization Among TGD Students, by Location.
Notes: *P < .05
ab: Within sections, predicted probabilities that share a letter are statistically equivalent (P > .05). Models adjust for assigned sex, grade in school, race/ethnicity and free/reduced-price lunch status among TGD students. Overall prevalence of bullying victimization for cisgender students is shown for reference only.
TGD = transgender and gender diverse

