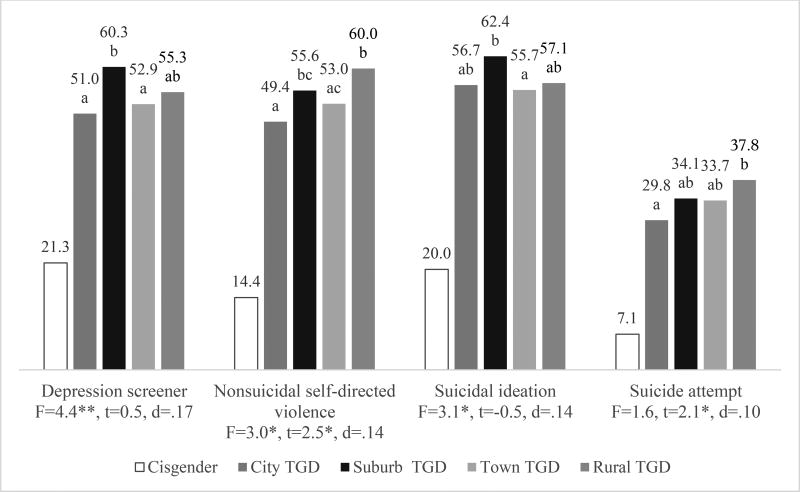
Figure 3. Predicted Probabilities of Emotional Distress Among TGD Students, by Location.
Notes: *P < .05; **P < .01
abc: Within sections, predicted probabilities that share a letter are statistically equivalent (P > .05). Models adjust for assigned sex, grade in school, race/ethnicity, free/reduced-price lunch status, any bullying victimization (past 30 days), and protective factors summary score, among TGD students only. Overall prevalence levels of emotional distress for cisgender students are shown for reference only.
TGD = transgender and gender diverse

