
Figure 6. Visualization of inflammasome activation in cardiomyocytes in response to pressure overload.
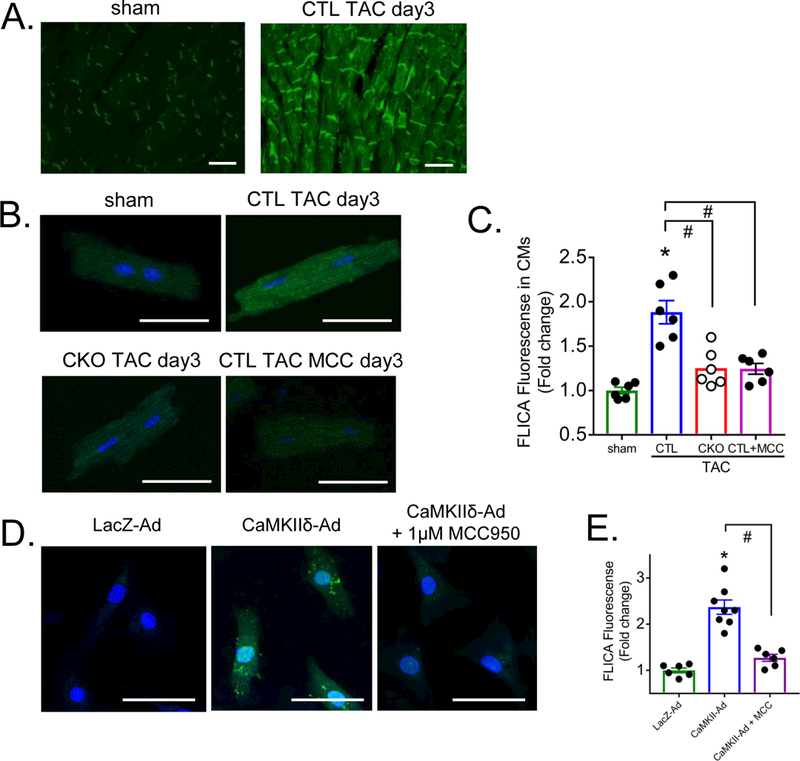
Representative image in cardiac section (A) and CMs (B) at day 3 of TAC. FAM-FLICA™ Caspase-1 assay kit was used to visualize caspase-1 activity. Scale bar = 50 μm. Mice were injected intraperitoneally with saline (-) or 10 mg/kg MCC950 (+) 1hr prior to TAC and twice daily for 3 days. (C) Quantification of FAM-FLICA Caspase-1 fluorescent signal in CMs. Data were quantified from 4–8 images per sample. N=6 per group (Male=3, Female=3). Data are presented as mean ± SEM. *P<0.05 vs sham, #P<0.05 vs CTL TAC by one-way ANOVA followed by Tukey’s multiple comparisons test. (D) Representative image and (E) quantification of fluorescence in NRVMs infected with AdLacZ or the constitutively active δC isoform of CaMKII (AdCaMKIIδ) at a multiplicity of infection of 50. NRVMs were starved for 5 hours prior to a 3-hour infection then washed with serum-free medium and cultured overnight. MCC950 (1 μM) was applied at the time of virus infection and medium exchange. FAM-FLICA Caspase-1 assay kit was used to visualize caspase-1 activity, scale bar= 50 μm. N=6–8 per group. Data are presented as mean ± SEM. *P<0.05 vs LacZ-Ad, #P<0.05 vs CaMKIIδ-Ad by one-way ANOVA followed by Tukey’s multiple comparisons test.