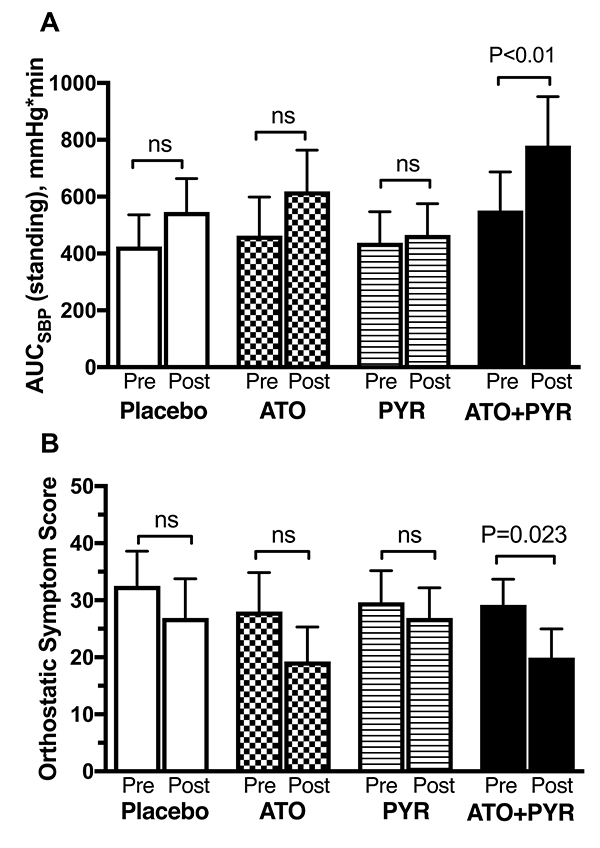
Figure 3.

Area under the curve of standing SBP (ΔAUCSBP, A) and orthostatic symptom score (B) at baseline (pre) and after 1-hour postdrug (post). The total score ranges from 0–60, with lower scores reflecting lower symptom burden. Values are expressed as mean±SEM. The P values were generated by Wilcoxon signed-rank test.
