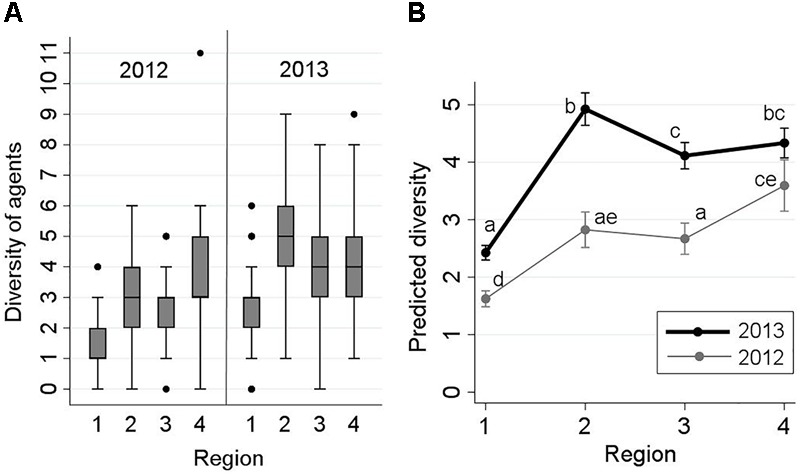
FIGURE 2.

Frequency distribution of the diversity of infectious agents detected in 2,006 Fraser River juvenile Sockeye salmon by sampling region and year (left side: A), and the interaction plot for the results of the Poisson regression model, indicating predicted number of detected infectious agents (Y-axis) from fish by sampling region (X-axis) and year (right side: B). Sampling regions: (1) Freshwater, (2) Strait of Georgia, (3) Discovery Islands, and (4) Johnstone Strait and north. Statistical comparisons among the predicted diversity of these regions are presented by small letters on the graph (Bonferroni groups). Small letters in (B) represent statistically significant differences (at α = 0.05) between the points (unique combinations of ‘region’ and ‘year’), obtained from pairwise comparisons using Bonferroni adjustments. Points that share, at least, a letter are not statistically different (P > 0.05), and points with no letters in common have statistically significant differences in the predicted diversity (P ≤ 0.05).
