
FIGURE 3.
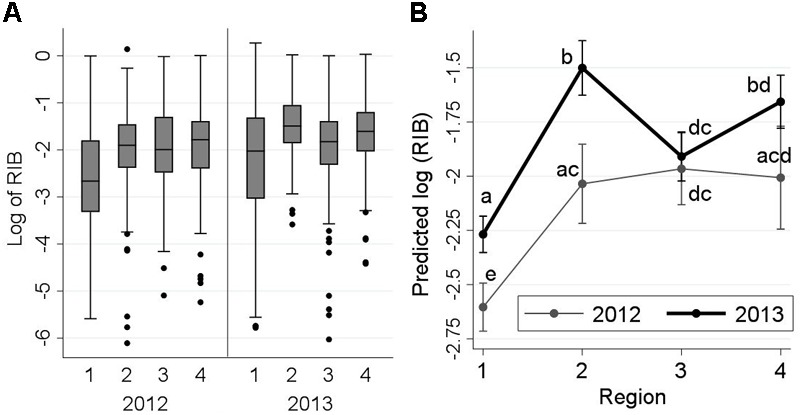
Frequency distribution of log10-relative infection burden (RIB) of all detected infectious agents from 2,006 Fraser River juvenile Sockeye salmon by sampling region and year (left side: A), and the interaction plot for the results of the linear regression model (right side: B), indicating predicted log10-RIB (Y-axis) for the fish by year and sampling region (X-axis). Sampling regions: (1) Freshwater, (2) Strait of Georgia, (3) Discovery Islands, and (4) Johnstone Strait and north. Statistical comparisons among the predicted log10-RIB of these regions are presented by small letters on the graph. Small letters in (B) represent statistically significant differences (at α = 0.05) between the points (unique combinations of ‘region’ and ‘year’), obtained from pairwise comparisons using Bonferroni adjustments. Points that share, at least, a letter are not statistically different (P > 0.05), and points with no letters in common have statistically significant differences in the predicted RIB (P ≤ 0.05).