Fig. 3.
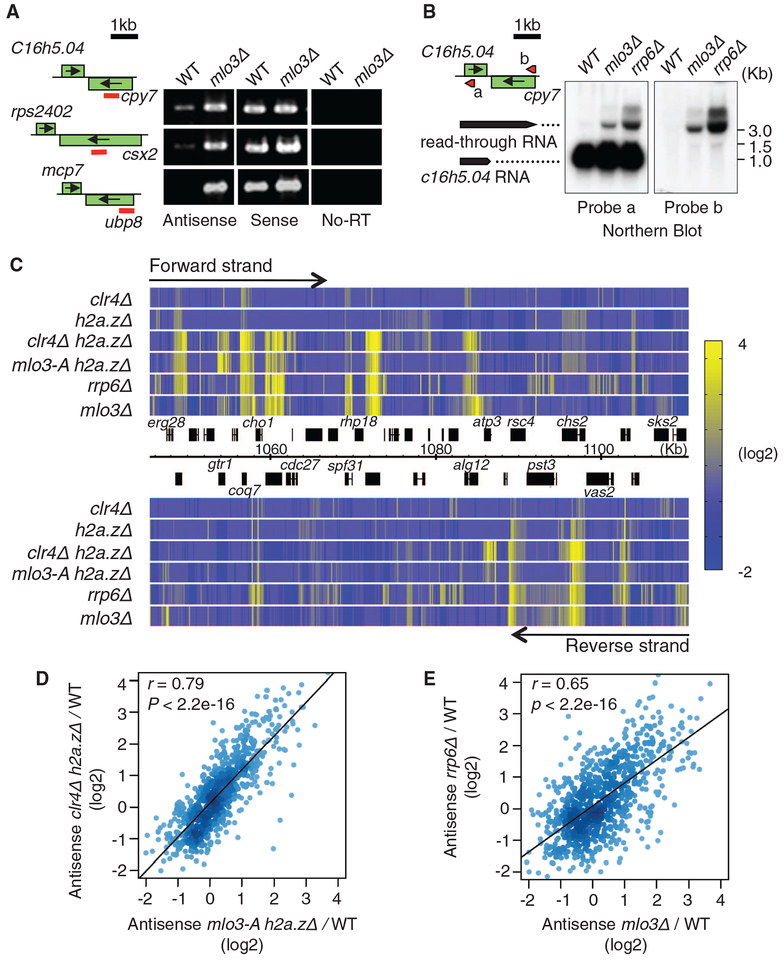
Mlo3 is required for suppression of antisense RNAs targeted by Clr4 and by the exosome. (A) Strand-specific RTPCR of RNA isolated from WT and mlo3Δ. (B) Northern blot analyses of RNA at SPBC16h5.04-cyp7. Probes complementary to sense (probe a) or antisense (probe b) strands of SPBC16h5.04 gene are shown by red arrows indicating the probe position and 5′ to 3′ direction. (C) Heat map showing up-regulation of antisense RNA in indicated strains at a representative region of chromosome 2. Transcriptome profiling was performed using tiling microarray. Forward-strand transcripts are shown on top, and reverse-strand transcripts are shown at the bottom. Relative expression values (mutant/WT) were converted into color gradient. (D and E) Density plot comparing changes in antisense RNA levels in clr4Δh2a.zΔ and mlo3-Ah2a.zΔ(D), or rrp6Δ and mlo3Δ (E). Median antisense ratios were calculated for 842 genes. Pearson’s correlation coefficient (r) and the P value of the linear regression are indicated.

