FIG. 2.

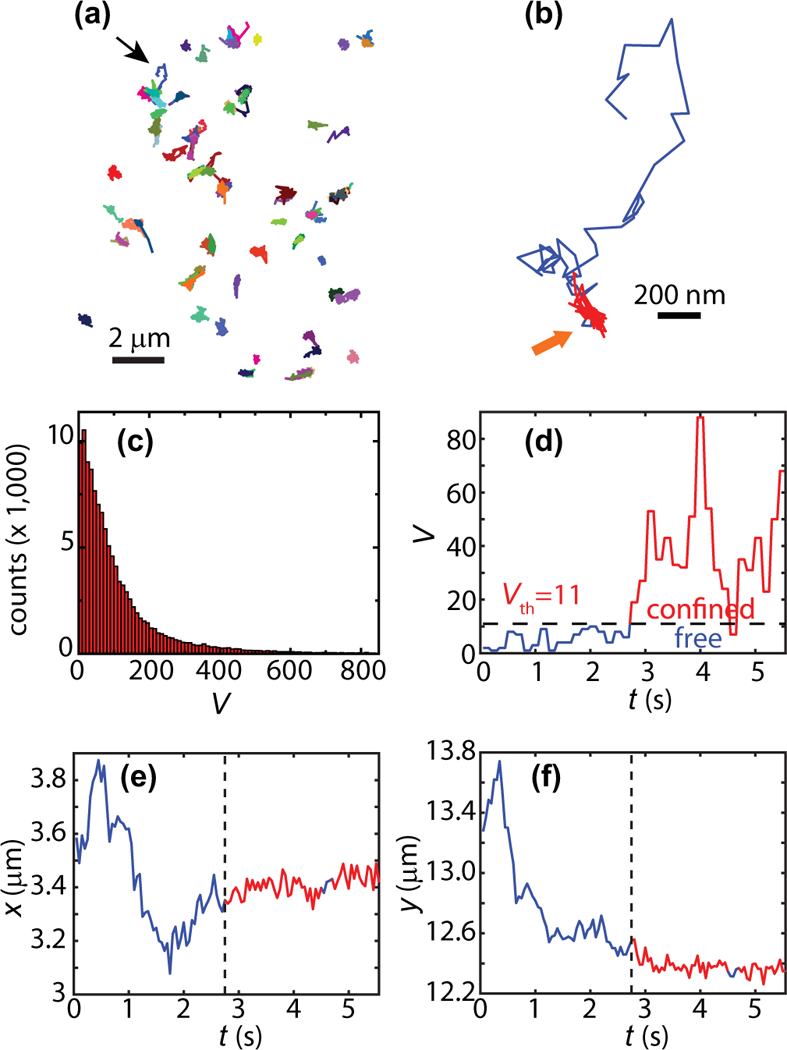
Segmentation of Kv1.4 trajectories. (a) 92 individual Kv1.4 trajectories in one hippocampal neuron. (b) Zoom of the trajectory indicated with a thin black arrow. The periods of confinement within this trajectory are shown in red. (c) Histogram of the number of visits to current site, Vj (117,195 sites; 649 trajectories).As explained in the text, the sites are determined by the exploration in 150 ms. This metric is used to evaluate how compact the random walk is and to identify regions of confinement. (d) Time series of number of visits Vj for the trajectory in panel (b). When the number of visits is above the threshold Vth = 11, the particle is considered to be in the confined state. At 4.6 s, Vj drops below the threshold during three points in the time series. However, because the dwell time is not longer than three points, i.e., a single time window, this region is considered to remain in the confined state. This region is indicated by a thick yellow arrow in panel (b). (e, f) time series of localization along x and y for the trajectory shown in panel (b). The regions that are detected to be confined are shown in red and the identified switching point marked by dashed vertical line.
