
FIG. 3.
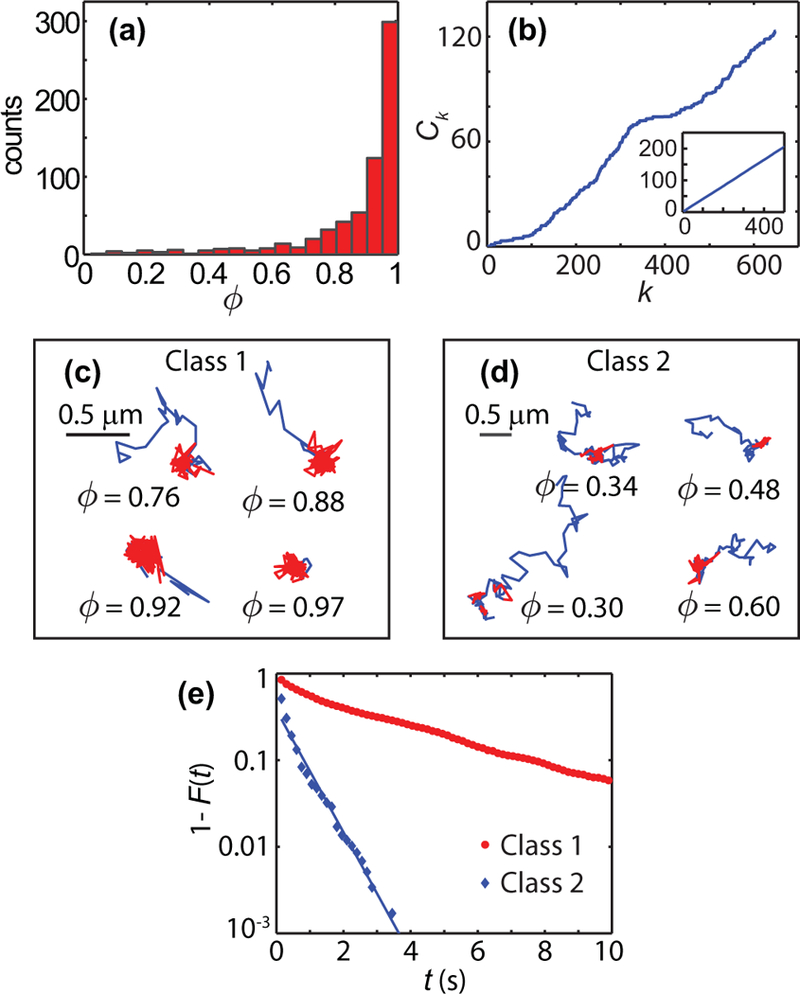
Determination of number of distinct classes among Kv1.4 trajectories (649 trajectories, 9 cells). (a) Histogram of fraction of the observation time that a particle spends in the confined state. (b) Regime variance test statistic The regime variance test rejects the hypothesis of a single regime with p = 10−3. The inset shows the regime variance test applied to 500 realizations of numerical simulations of the type shown in Fig. 1. In these simulations, the test does not reject the hypothesis of a single class of trajectories (p = 0.29). (c, d) Examples of Kv1.4 trajectories in the two distinct classes. The fraction φ is given for each example. (e) Complementary cumulative distribution function of the residence times in confined states for each of the two classes (Class 1: 1 659 sojourn times, 575 trajectories; Class 2: 575 sojourn times, 74 trajectories).