Figure 1:
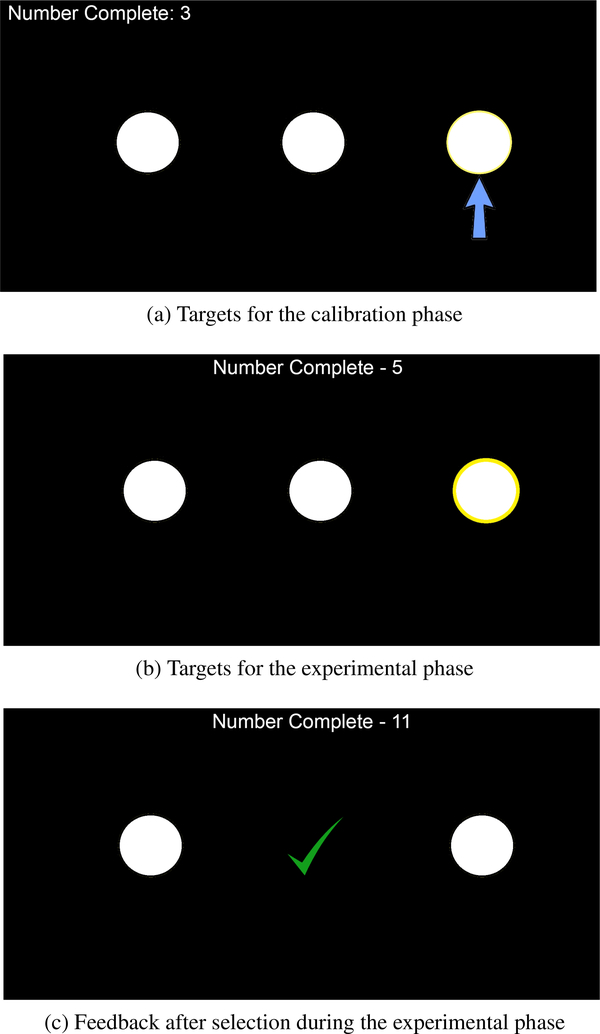
Graphical representations of the experimental interface. (a) Shows how targets were identified with an arrow during the calibration phase. (b) Shows how the target was highlighted during the experimental phase. (c) Shows the feedback given to the user after the classifier guessed the predicted target. Note that the size of the targets and text have been enlarged to improve readability.

