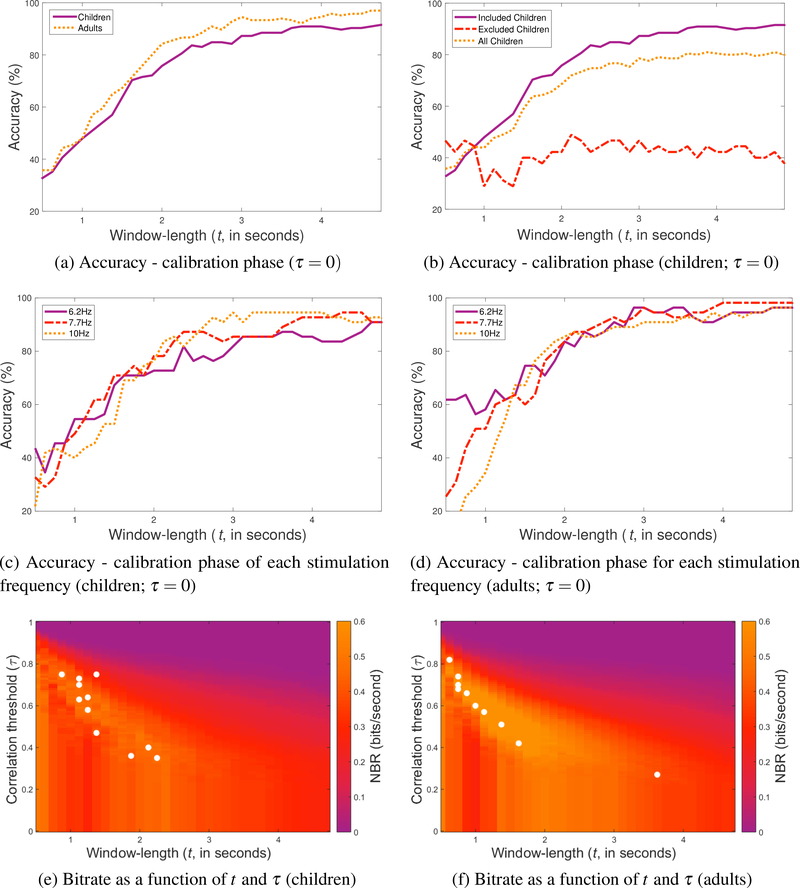
Figure 2:
Performance of participants from data collected during the calibration phase based on the post-experiment analysis. Accuracy of (a) included children versus included adults, (b) included children versus excluded children and the average of all of the children, (c) included children for each stimulation frequency as a function of t and τ = 0, and (d) included adults for each stimulation frequency as a function of t for τ = 0. Images showing bitrate calculated for each t and τ for (e) included children and (f) included adults. The t and τ values used for each participant in the experimental phase are denoted by a white dot.

