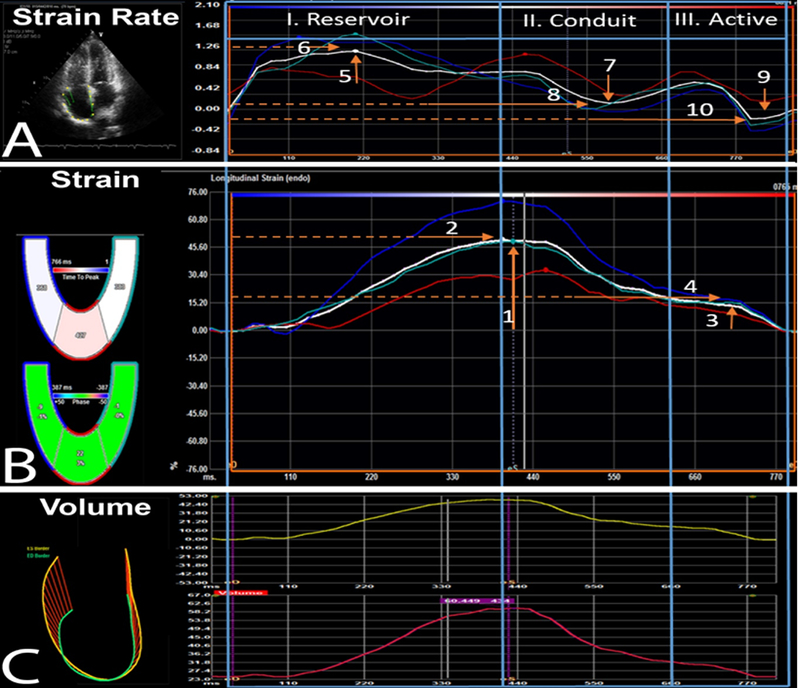
Figure 1:

RA phasic function strain and strain rate speckle tracking strain analysis. Abbreviations: A. RA Strain Rate; B. RA Strain; C. RA Volumes: 1. Peak longitudinal strain [PLS]; 2. Time to PLS; 3. Peak active contraction strain [PACS]; 4. Time to PACS; 5. Peak systolic strain rate [PSSR]; 6. Time to PSSR; 7. Peak diastolic strain rate [PEDSR]; 8. Time to PEDSR; 9. Peak contraction strain rate [PCSR]; 10. Time to PCSR. R- wave (QRS complex) was the zero reference and all strain values were positive.
