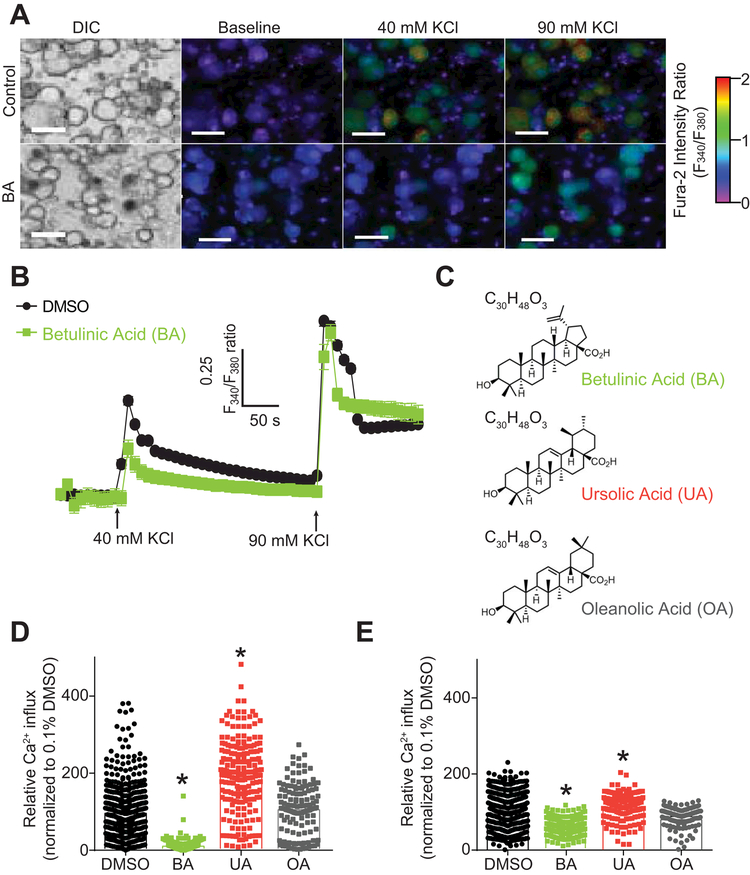
Figure 2. BA inhibits depolarization-evoked Ca2 influx in DRG sensory neurons.
(A) Differential interference contrast (DIC) and pseudocolored fluorescent images visualized for Fura2-AM before and after stimulations with 40 mM and 90 mM KCl. A stimulation period of 15 seconds each with 40 and 90 mM KCl followed an initial 1-minute baseline measurement; response was subsequently measured for 3 minutes after each stimulation. Scale bar is 20 µm. Fluorescent scale shows relative intracellular calcium [Ca2+] in each Dorsal Root Ganglia (DRG) neuron (F340/F380). (B) Traces of response average of compounds BA, UA, OA and vehicle (0.1% DMSO). Arrows indicate the initiation of a 15 second stimulation period of the DRG sensory neurons with 40 or 90 mM KCl as indicated. (C) Structures and molecular formulas of compounds BA, UA, and OA. (D-E) Bar graphs show normalized peak calcium response average ± S.E.M. of DRG sensory neurons incubated overnight with a 20 µM concentration of compounds BA, UA, OA and vehicle in response to 40 (D) and 90mM KCl (E). Responses were normalized to that of the DMSO. Asterisks indicate statistical significance compared with cells treated with the vehicle (p<0.05, one-way ANOVA with Dunnett’s post-hoc test).

