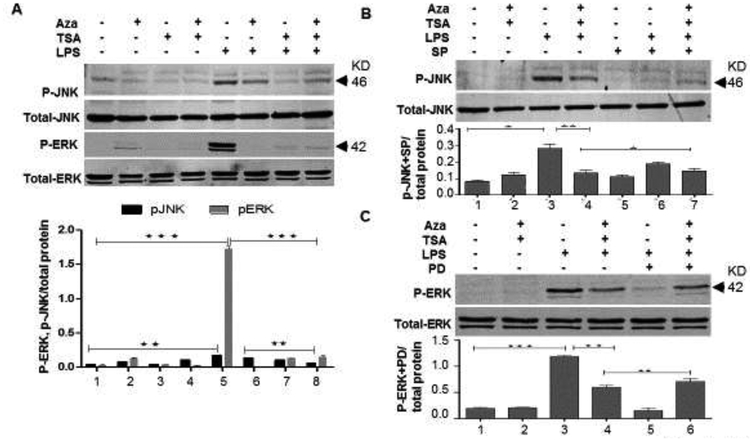
Figure 2. Aza and TSA together abrogates LPS induced activation of p-JNK and p-ERK in BMDMs.
(A) Western analysis and the graphical representation data showed that the LPS-challenged BMDMs treated with Aza (50nM) and TSA (25nM) have lesser p-JNK and p-ERK expression than the cells treated with Aza alone and TSA alone. (B, C) Western analysis data showed that, in presence of the inhibitors of p-JNK (SP600125) and p-ERK (PD98059), there is an increase in the expression of p-JNK and p-ERK respectively in the LPS induced BMDMs treated with Aza and TSA. Total JNK and ERK were used as a loading control. All the protein expressions were analysed from a single blot reprobed with different antibodies. Bands intensities were quantified using ImageJ. The ratio of band intensity was calculated by using the value of band intensity of experimental protein divided by its respective loading control. Data were expressed as means ± SEM of three replicated experiments. The numbers in the graph represent the corresponding lanes in the Western blots. *p < 0.05 LPS vs. LPS+TSA; **p< 0.01 LPS vs. LPS+Aza+TSA. A, Aza; T, TSA; L, LPS.

