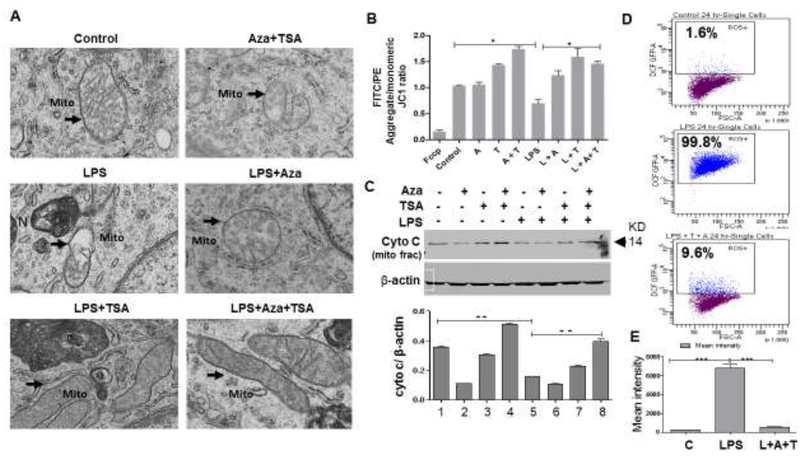
Figure 3. Epigenetic modifiers Aza and TSA restore mitochondrial membrane integrity after LPS stimulation.
(A) The electron microscopy (EM) image showed that the mitochondrial membrane integrity was compromised after LPS induction (marked with arrows) as compare to the LPS-induced BMDMs treated in combination of Aza (50nM) and TSA (25nM). (B) Mitochondrial depolarization was calculated by the red/green fluorescence intensity ratio from the flow cytometry analysis of JC1 staining. High red/green ratio indicates better mitochondrial membrane potential. The data showed the loss of mitochondrial membrane potential (low ratio) after LPS challenges for 24 hours in the BMDMs which were rescued after treatment with Aza and TSA. FCCP (uncoupler, Carbonyl cyanide 4-(trifluoromethoxy)phenylhydrazone) was used as a positive control. (C) Western blot data and the graphical representation of mitochondrial membrane fraction showed that cytochrome C is more in the Aza and TSA treated BMDMs after LPS challenges when compared to the LPS induced BMDMs untreated or treated with either Aza alone or TSA alone. (D) Reactive oxygen species (ROS) was estimated by flow cytometry after macrophages were challenged with LPS (24h) and further treated with Aza+TSA. Flow cytometry results show that LPS has induced ROS in 99.8% of cells which was reduced to 9.6% when the cells were treated with Aza and TSA together. (E) Graphical data represent the mean intensity was higher in LPS-induced BMDMs and it was significantly reduced in LPS-induced BMDMs treated with Aza and TSA. The numbers in the graph represent the corresponding lanes in the Western blots. Data are expressed as means ± SEM, n =3 **P<0.01, ***P<0.001. A, Aza; T, TSA; L, LPS.

