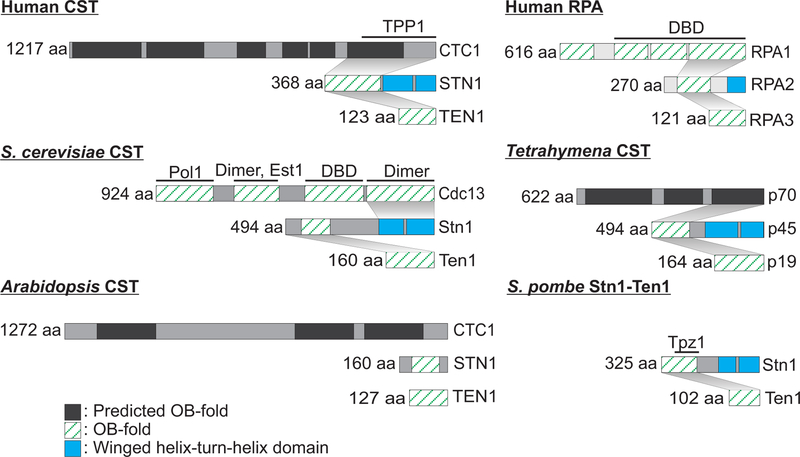
Figure 2.
Comparison of CST complexes and human RPA. OB-folds and winged helix-turn-helix domains are shown to scale based off published crystal structures or structure predications (see text for details). Black lines denote interactions sites with other proteins and DNA binding domains (DBD). Shaded areas between subunits denote interaction sites between CST subunits.

